vSAN Troubleshooting Dashboard
The vSAN (Virtual Storage Area Network) troubleshooting dashboard helps VI (Virtual Infrastructure) Admins get clear visibility into the health of their vSAN clusters. It is prioritized based on their core job responsibilities so that they can take immediate remediation action to bring their vSAN clusters back to a healthy state.
My Role
Sr. Product Designer
Company
VMware
Background
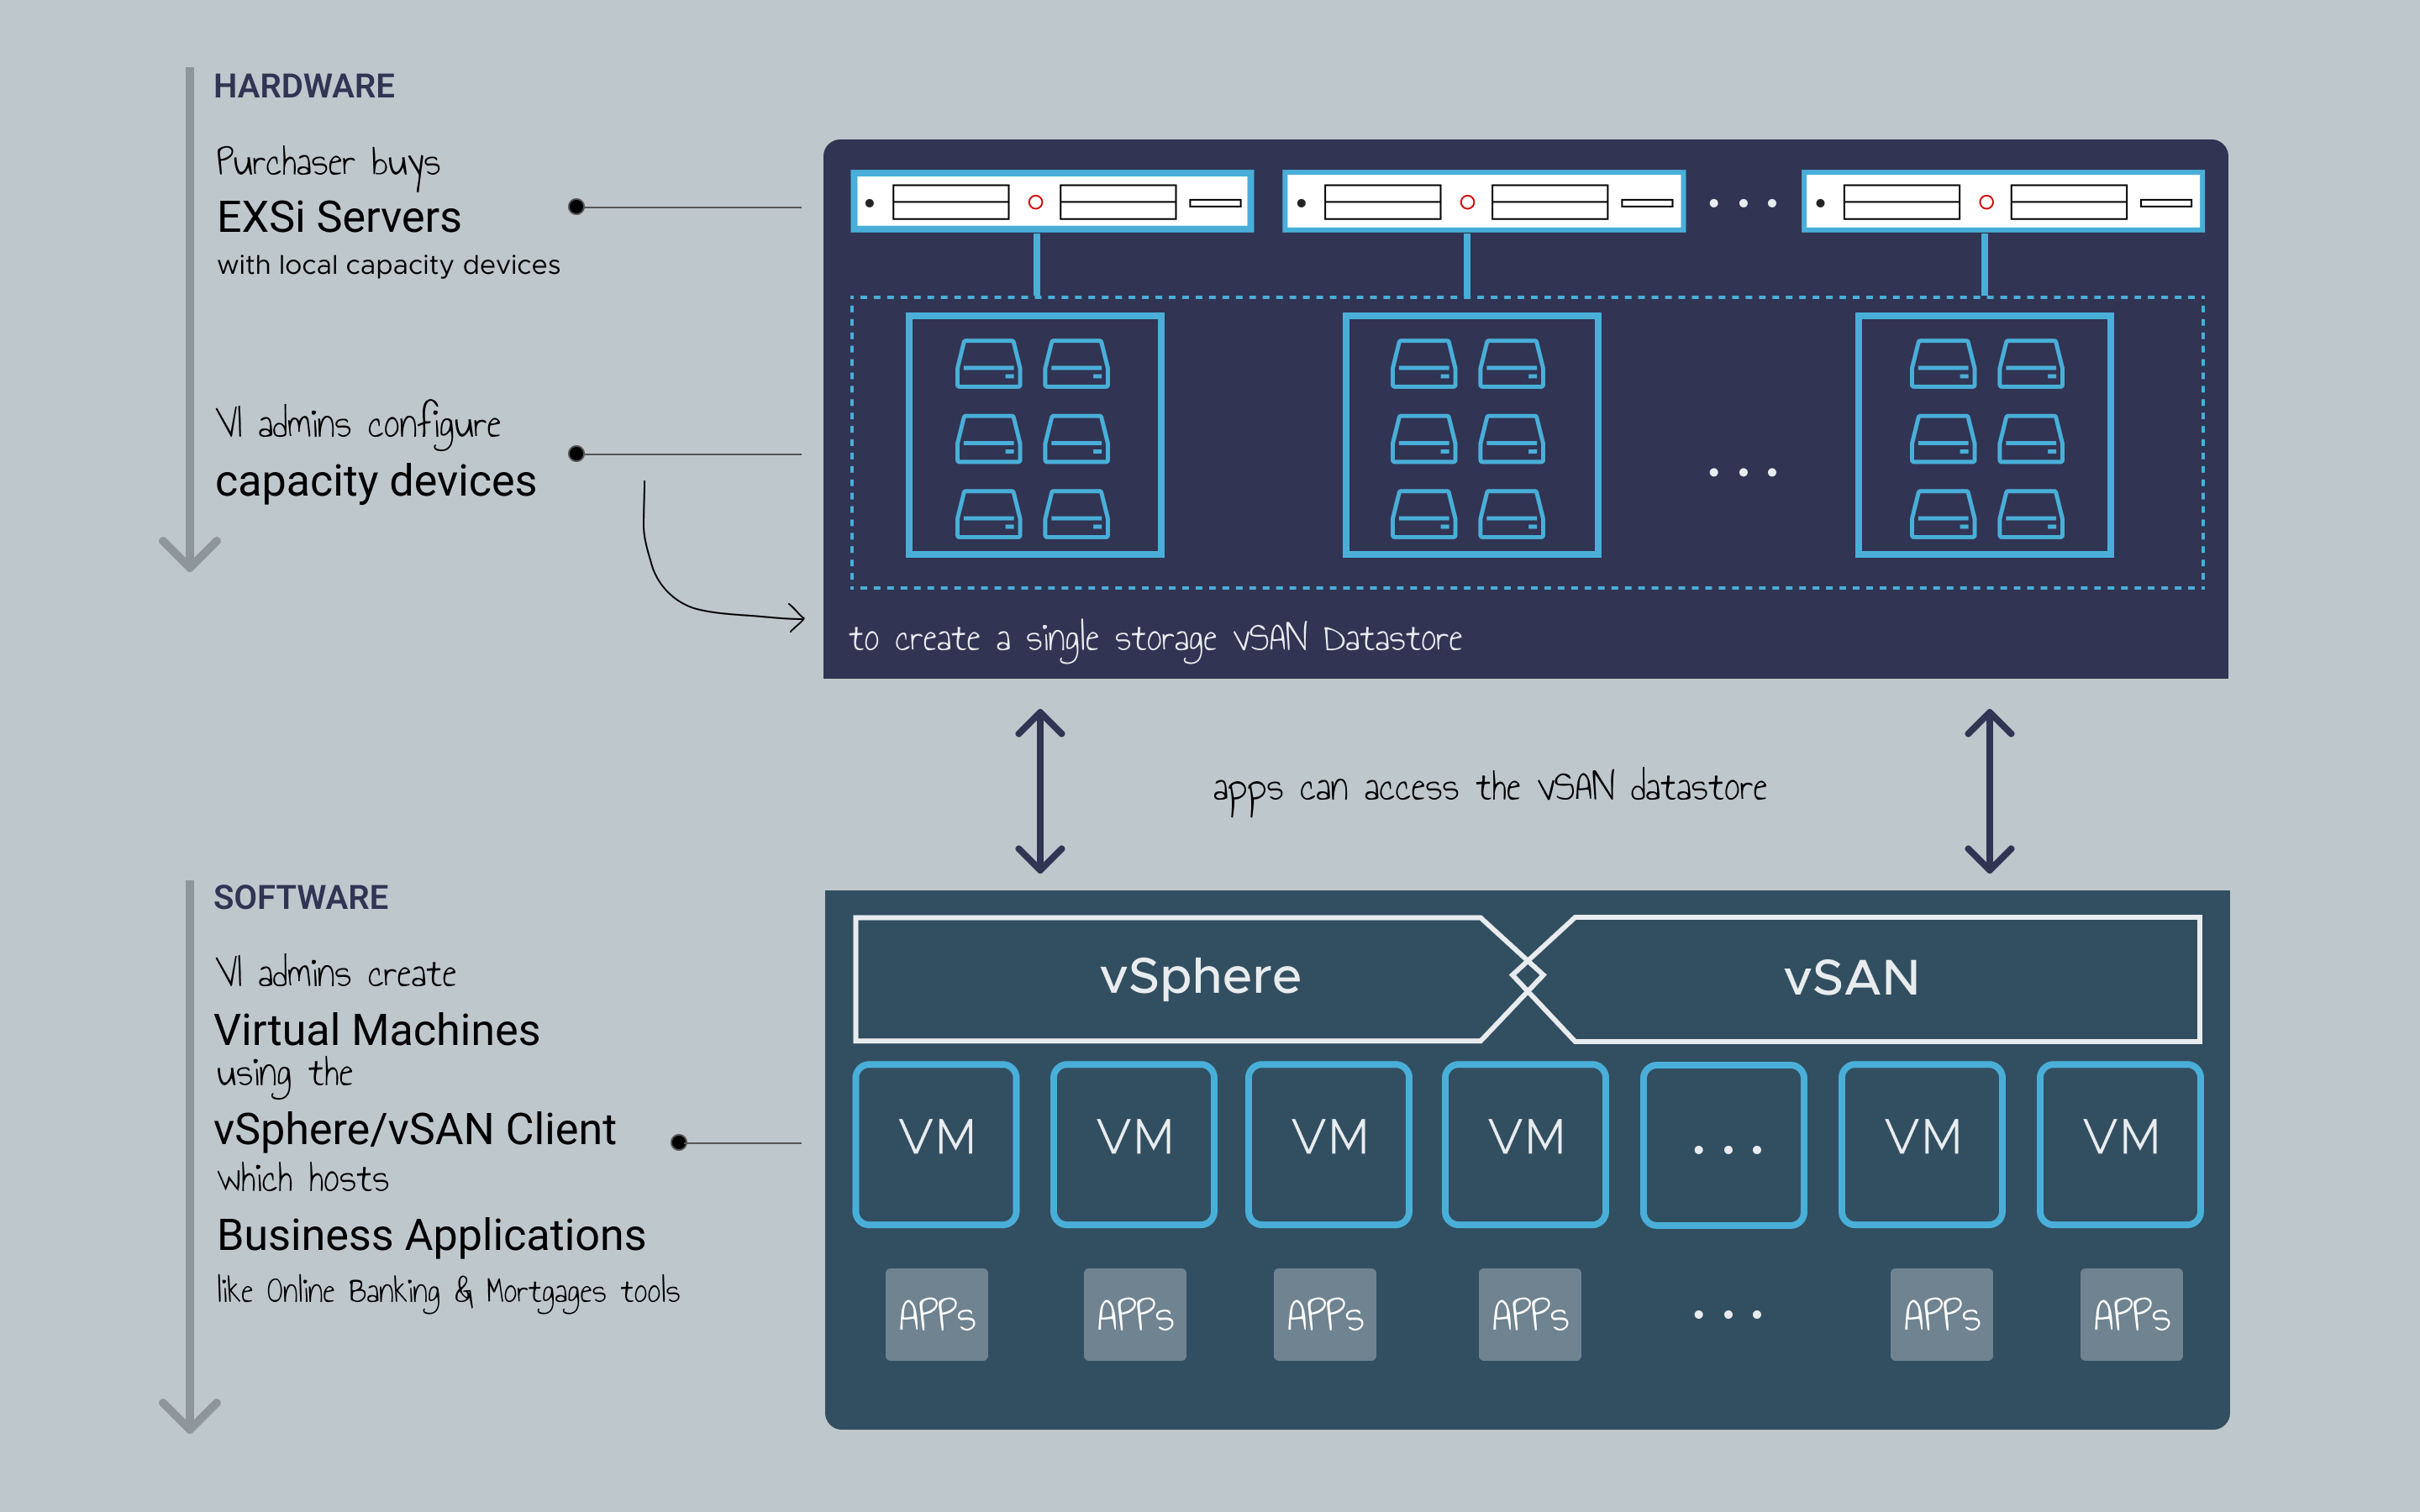
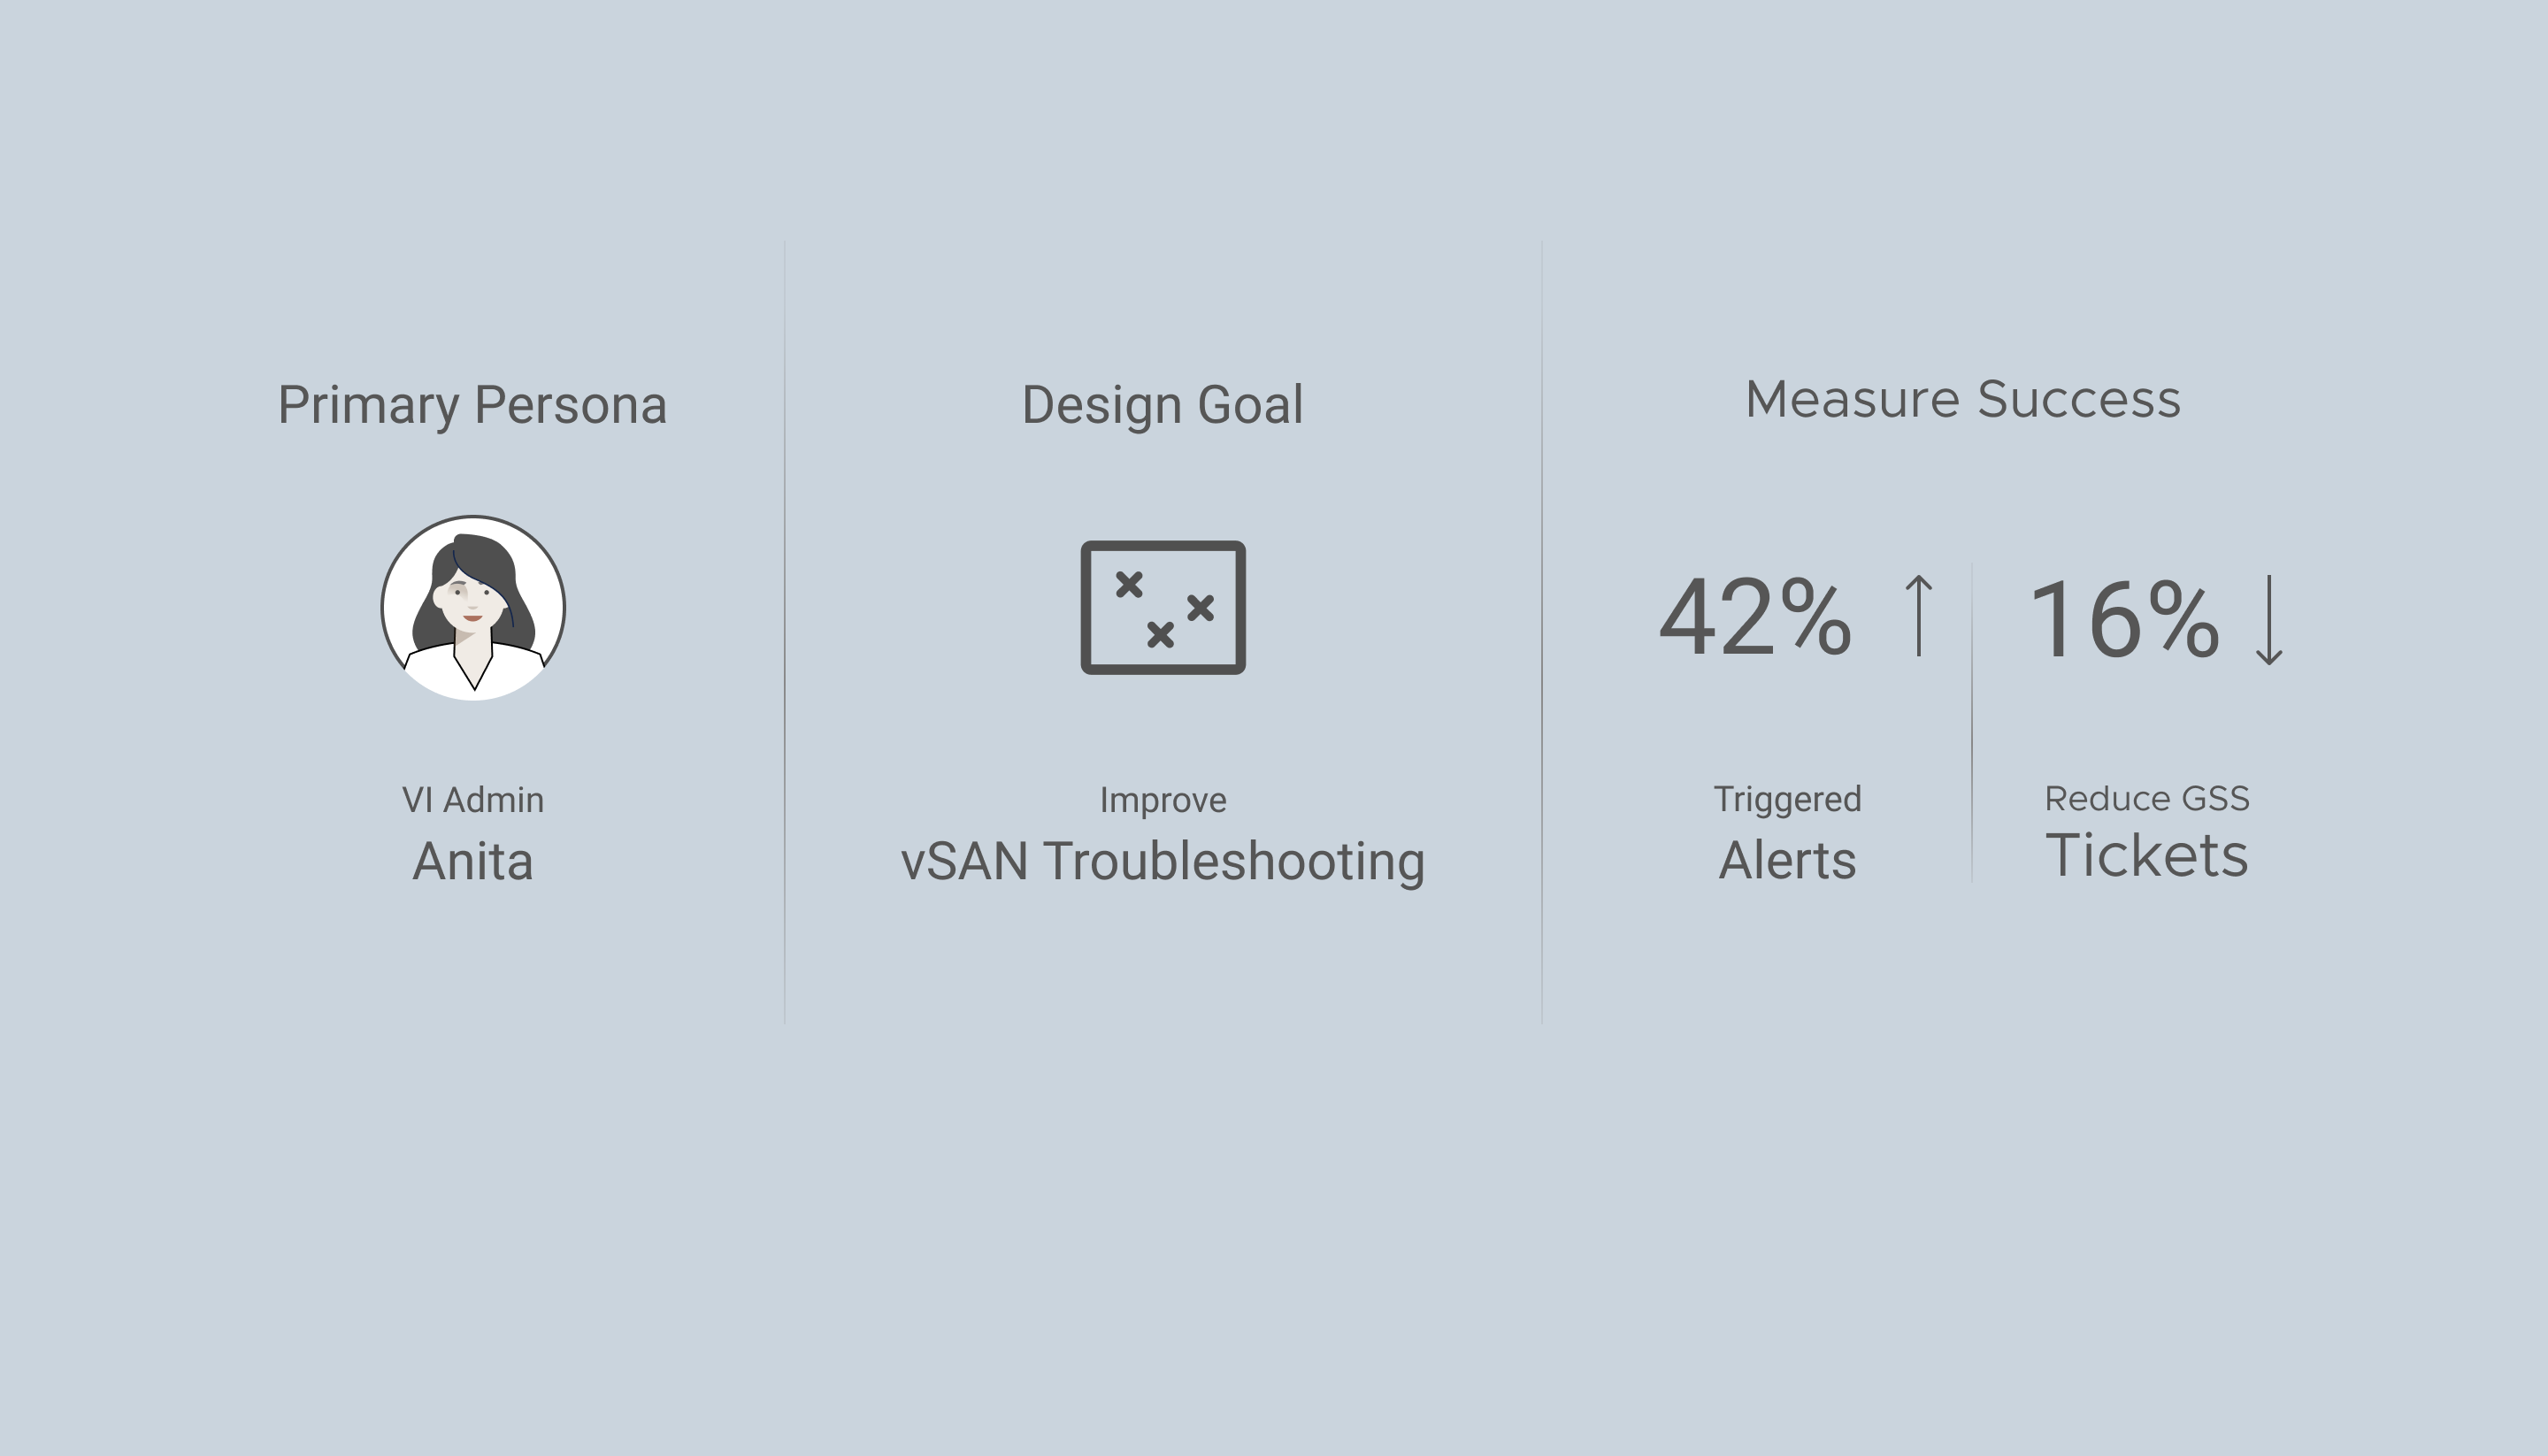
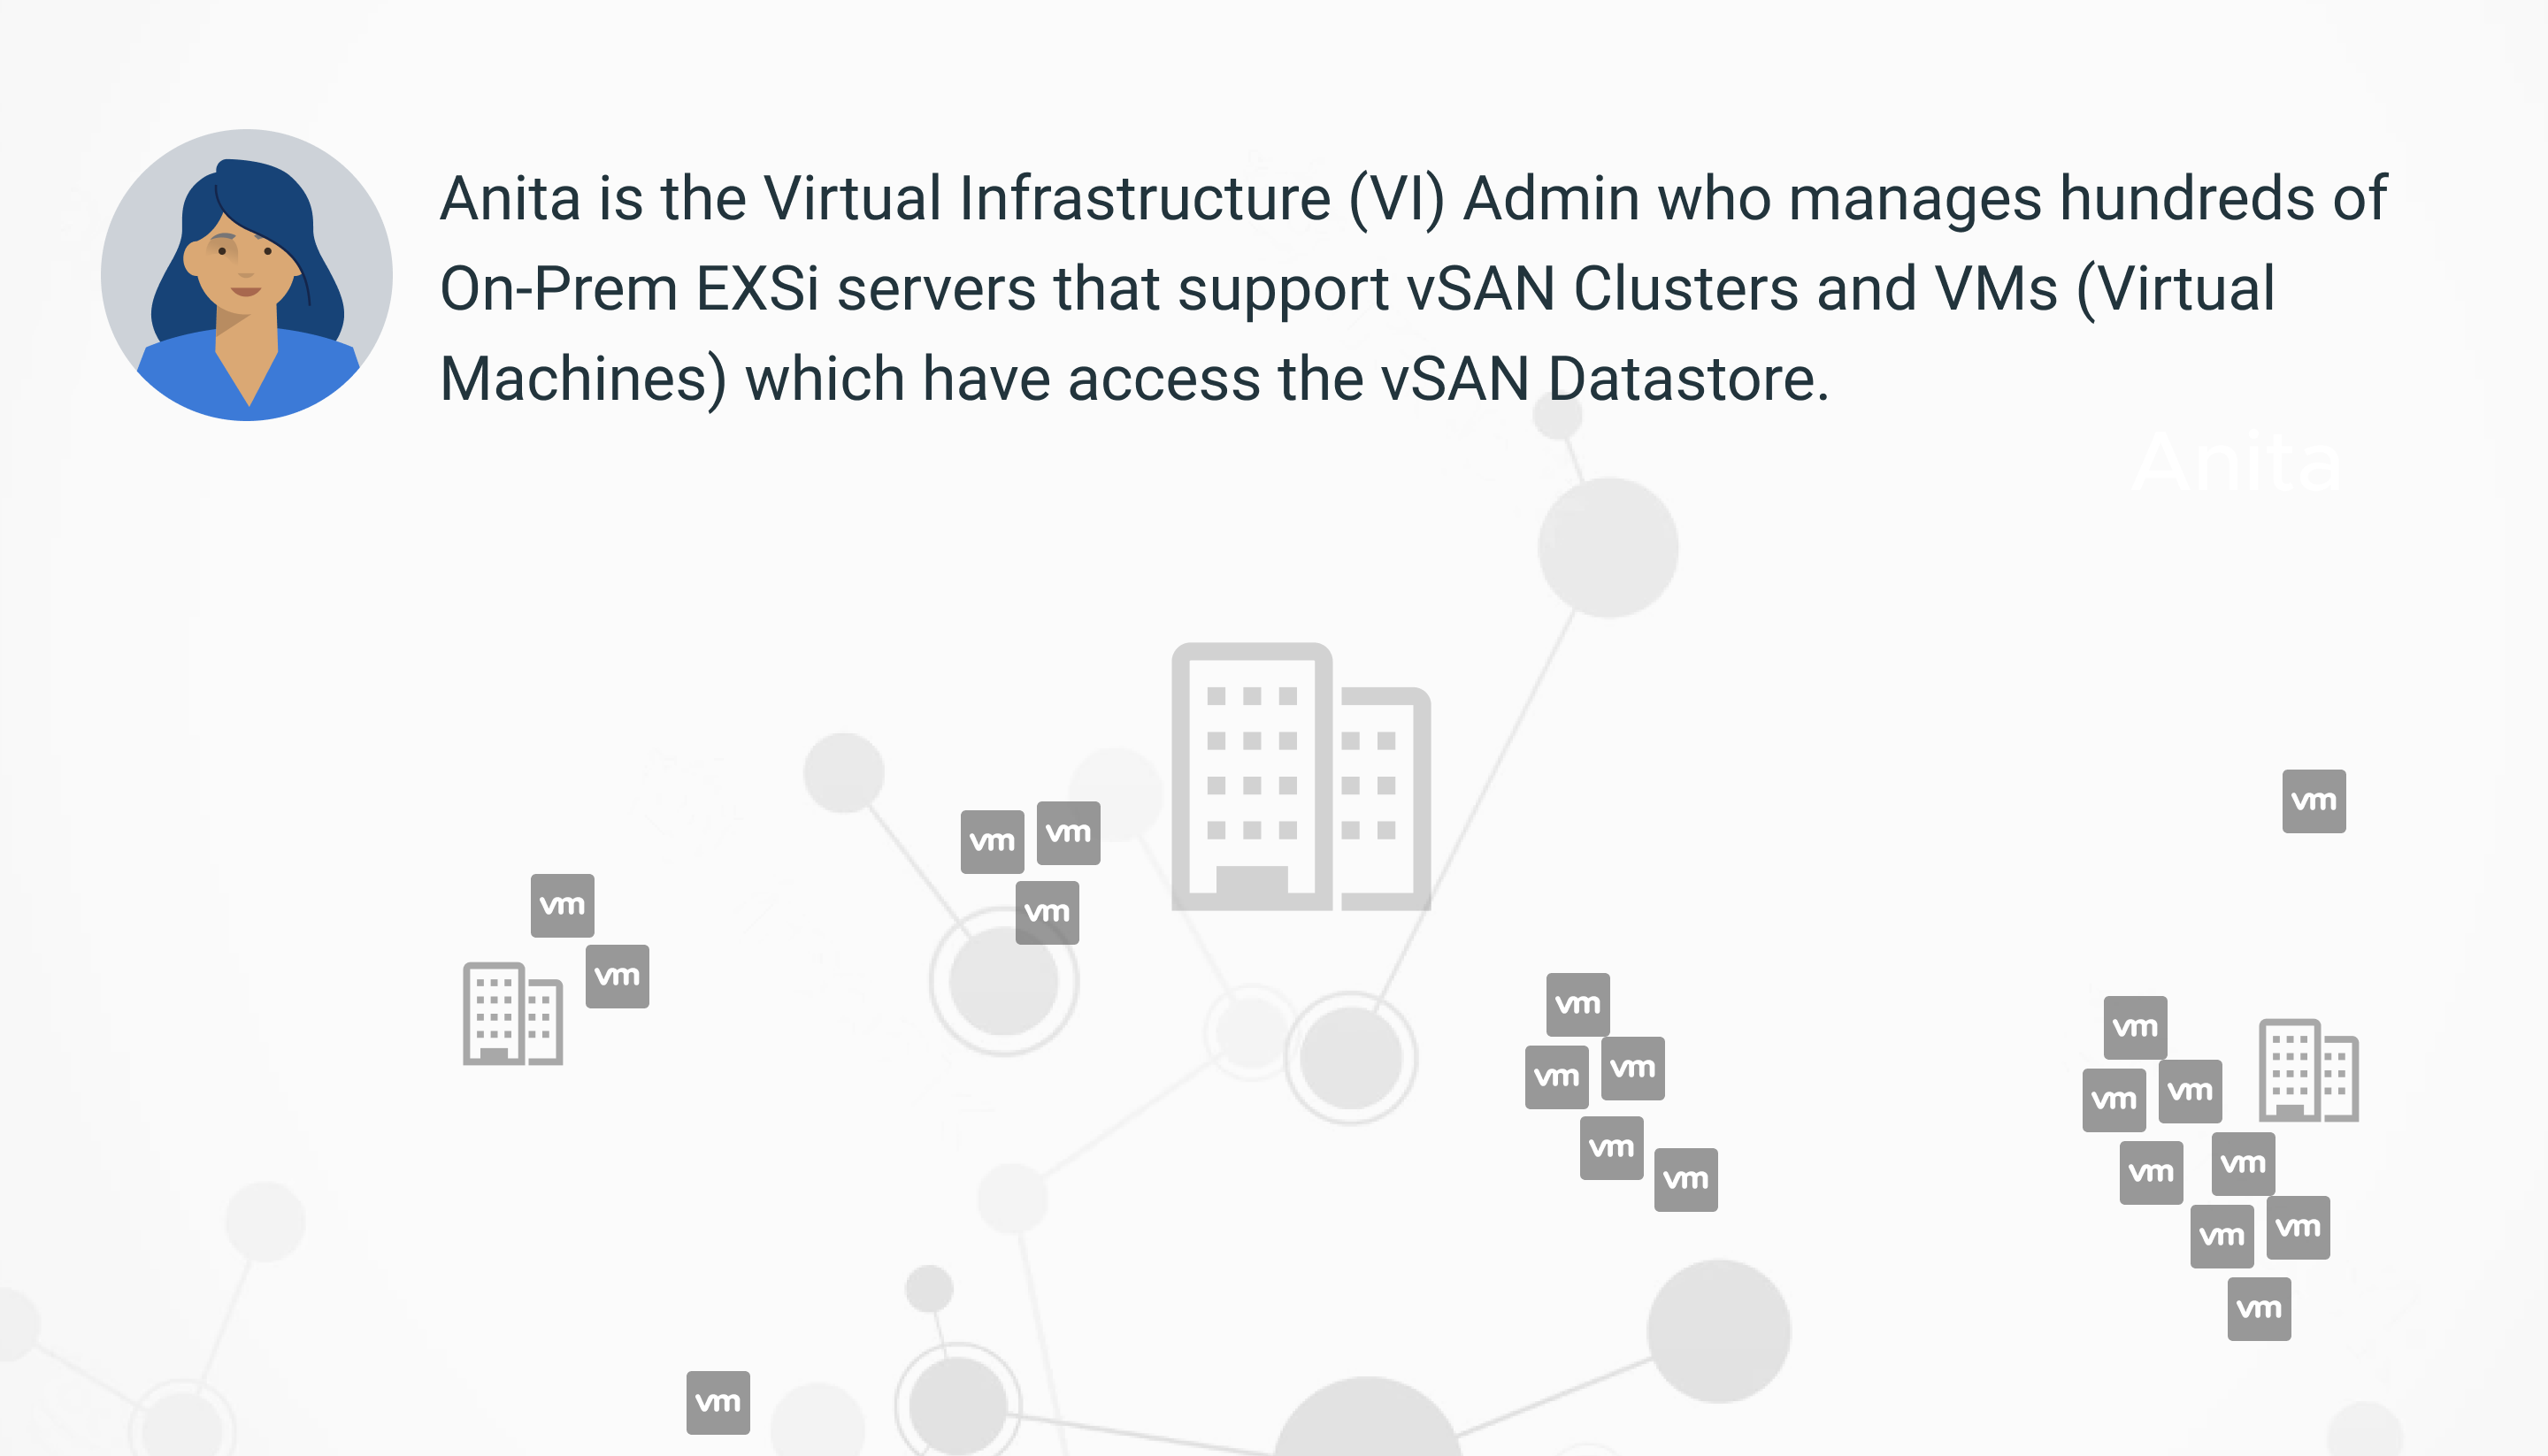
Who Is Our User?
Setting The Stage
VMware & Customer Goals
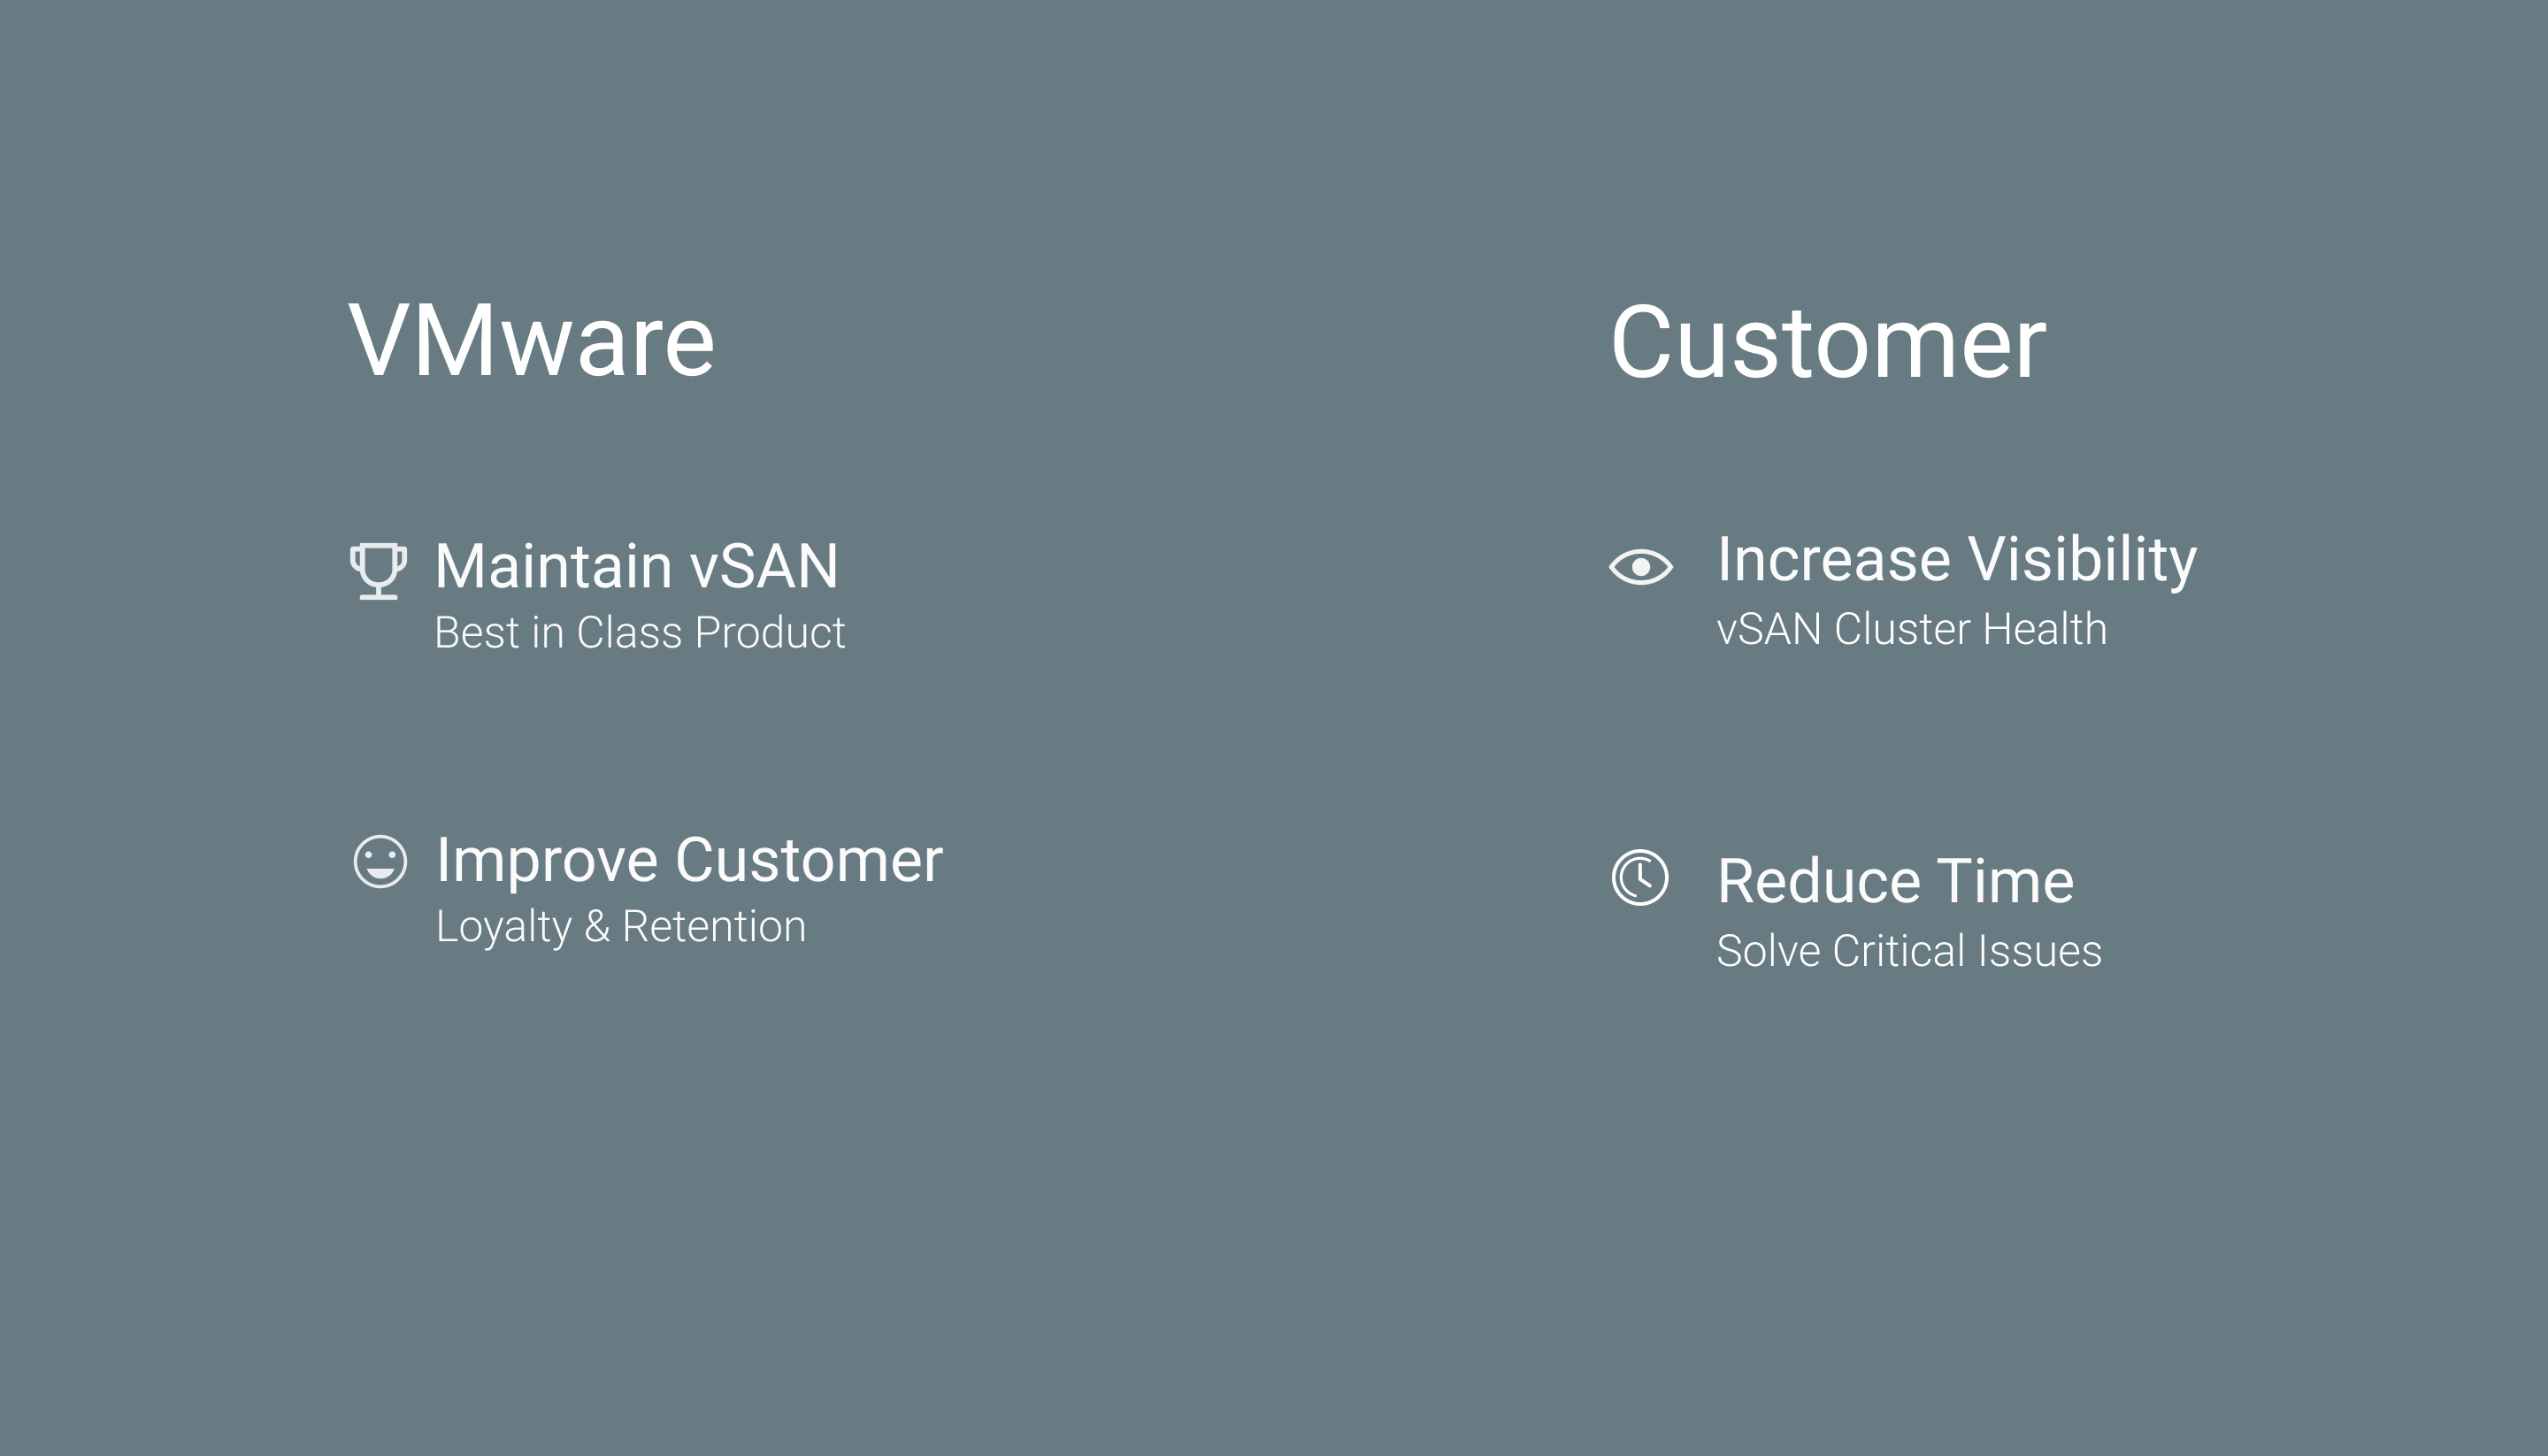
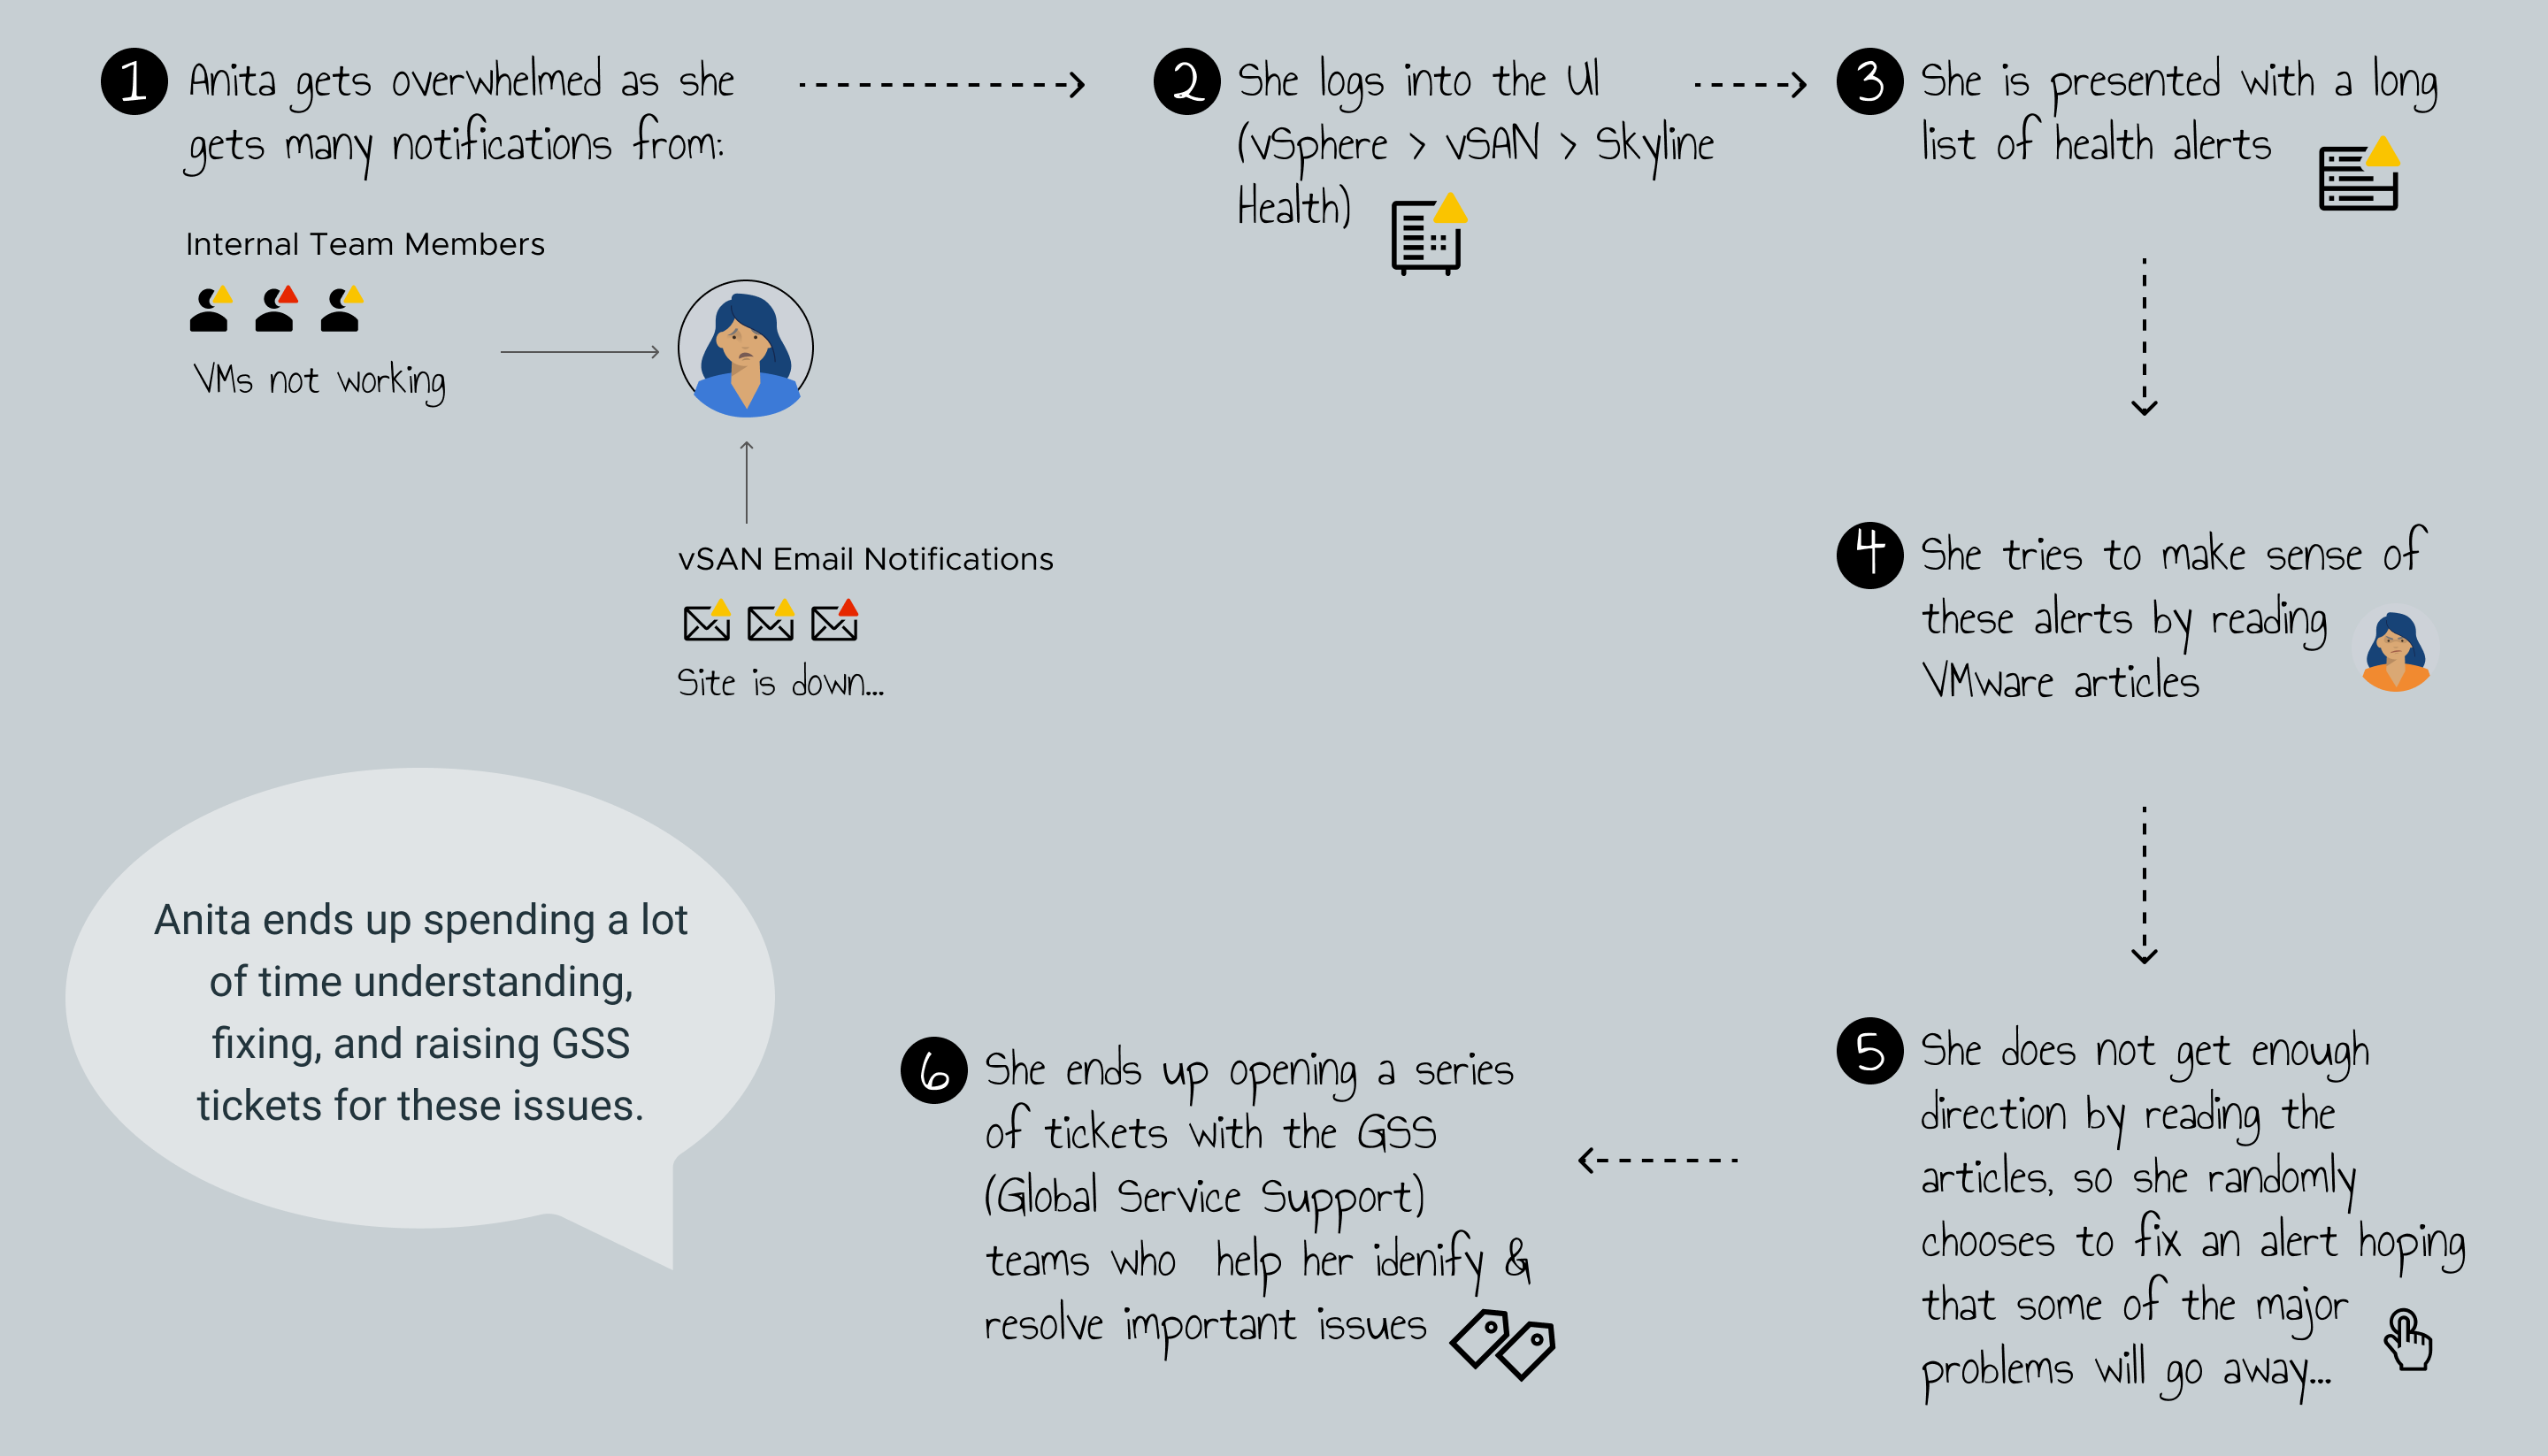
Existing Troubleshooting Process
Competitive Analysis
Finding: A visual way of troubleshooting clusters.

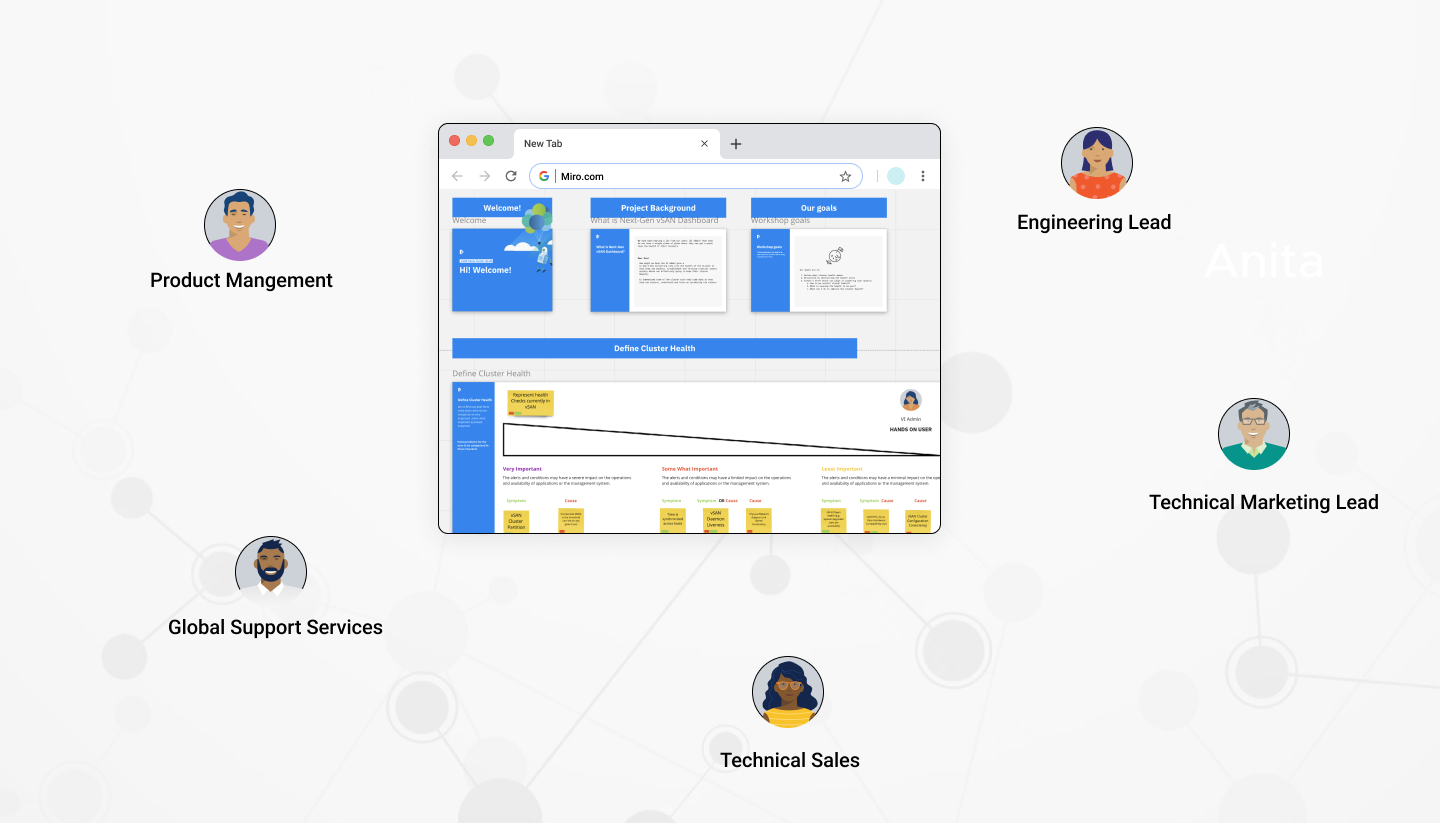
Product Planning Workshop
Product, Engineering, Technical Sales, and Global Service Support teams
Product, Engineering, Technical Sales, and Global Service Support teams
(Product, Engineering, Technical Sales, and Global Service Support teams)
(Product, Engineering, Technical Sales, and Global Service Support teams)
Product, Engineering, Technical Sales, and Global
Service Support teams
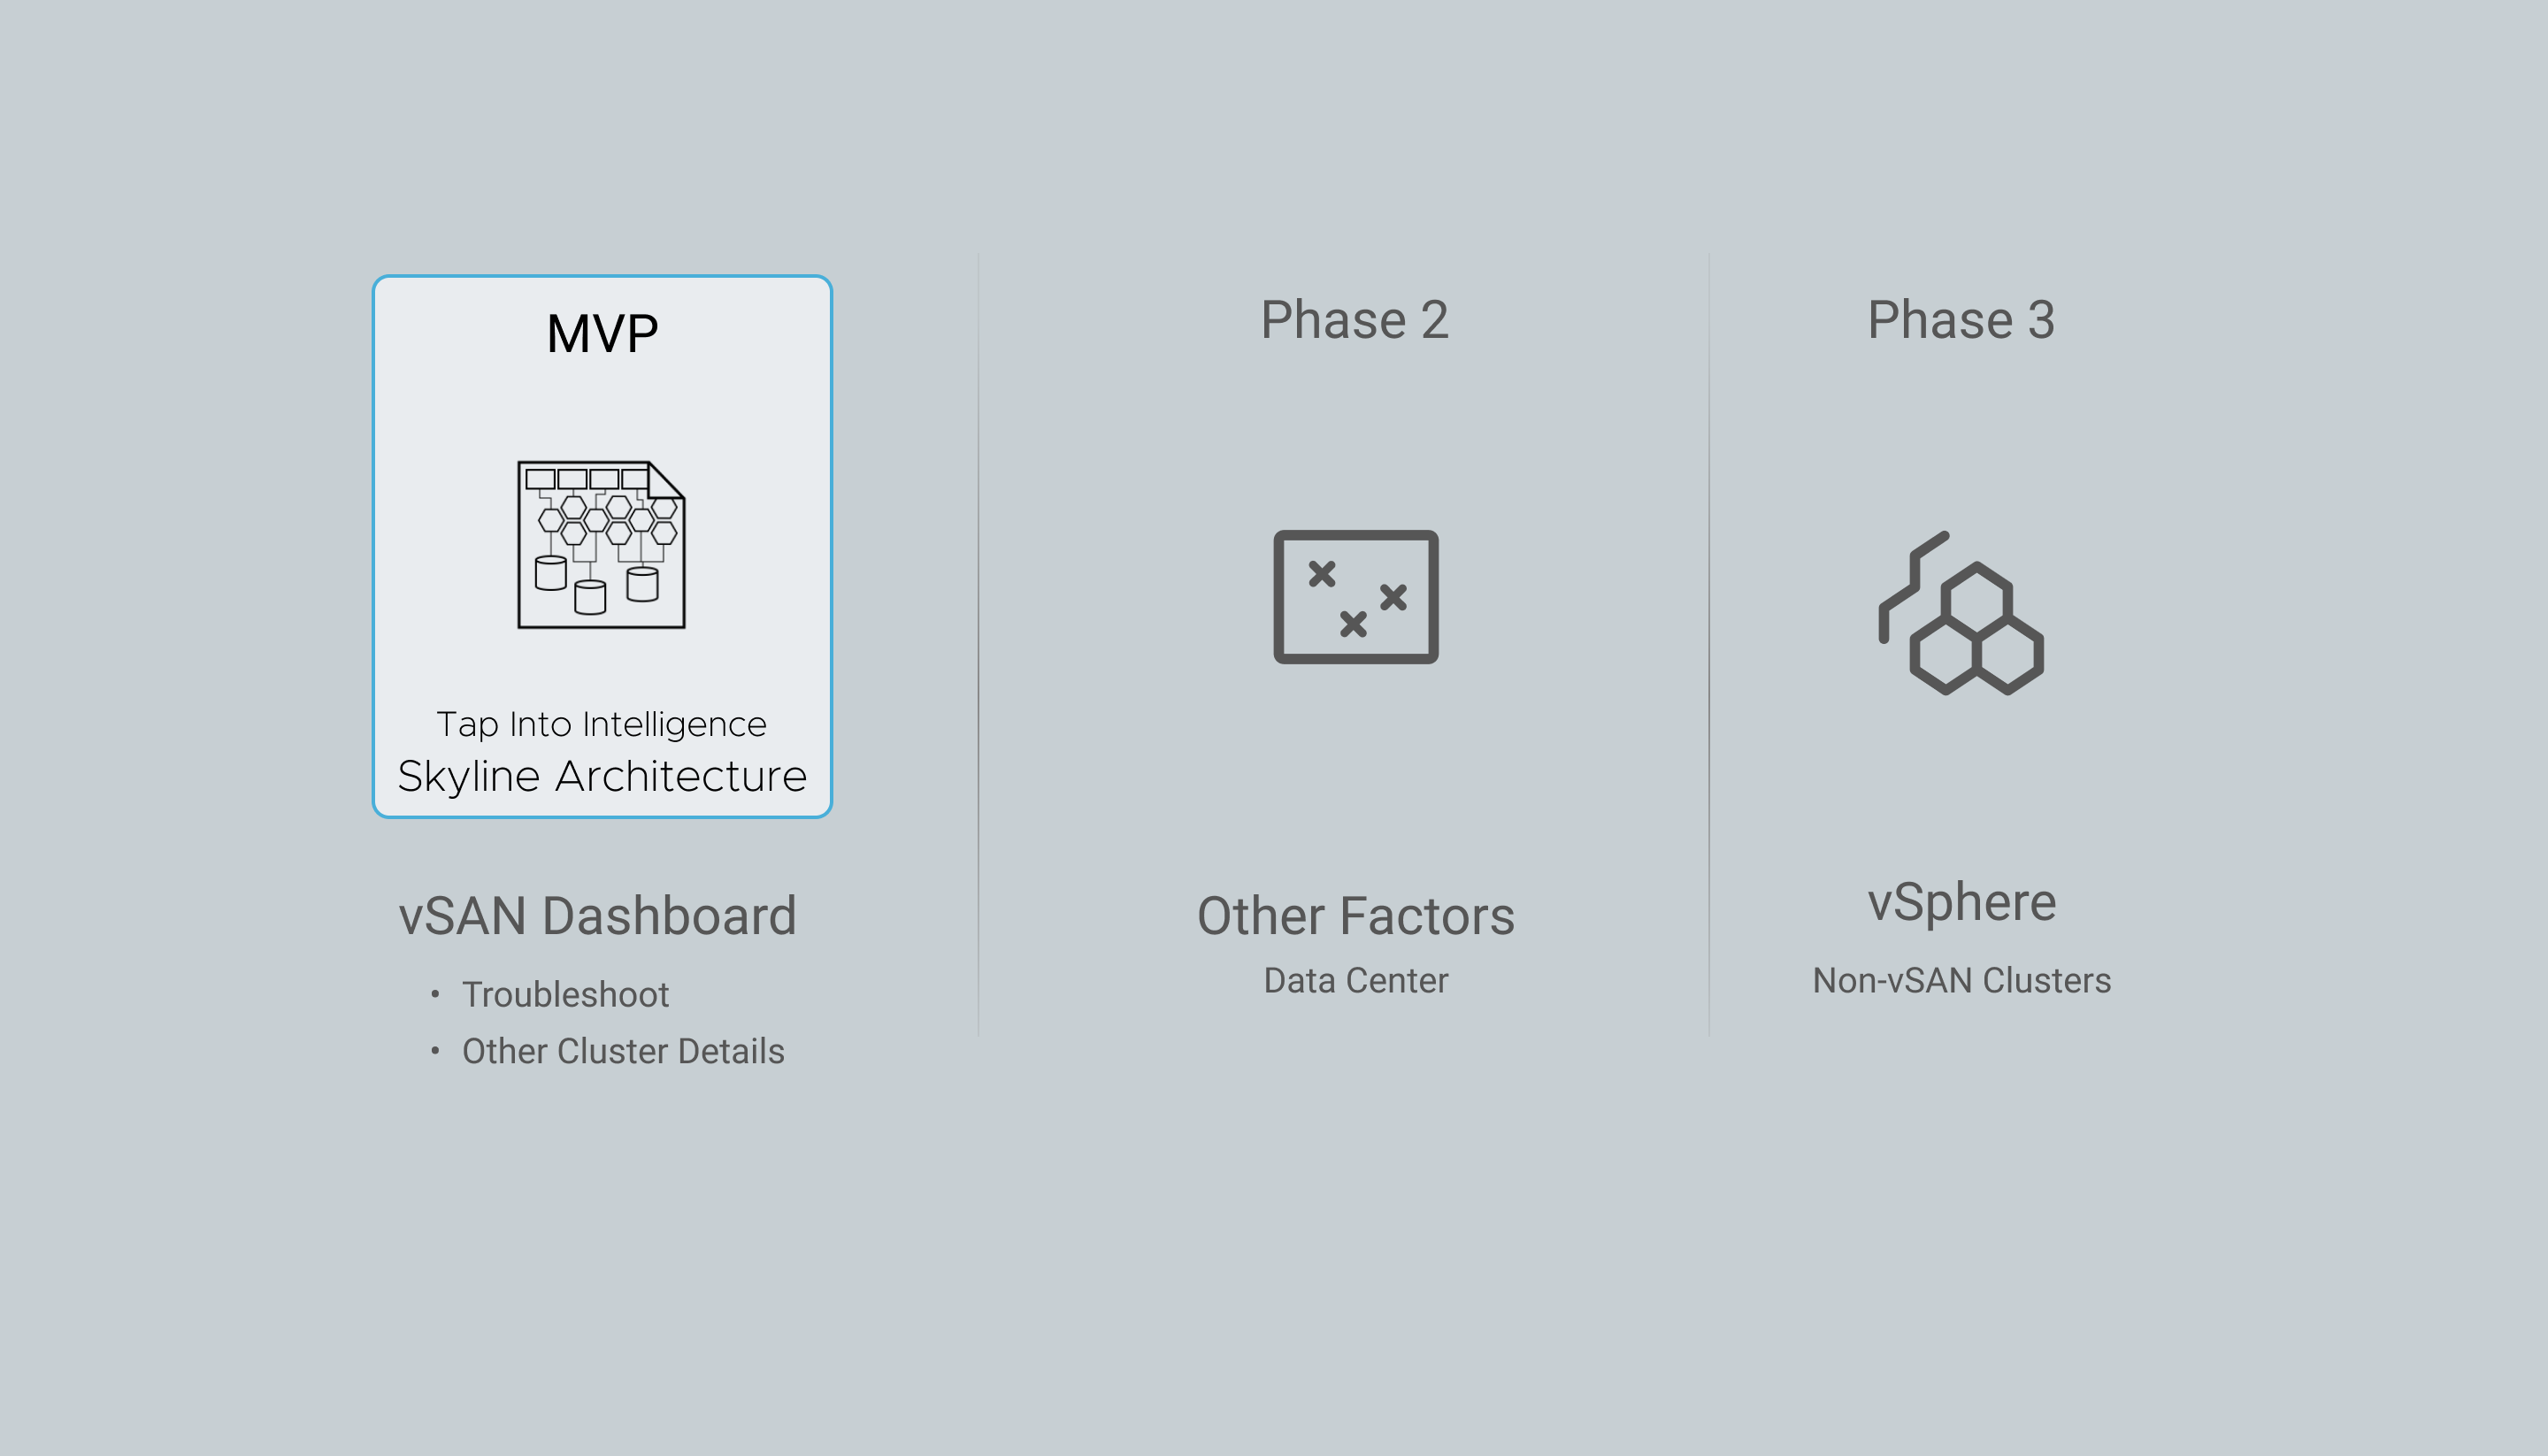
Product Roadmap
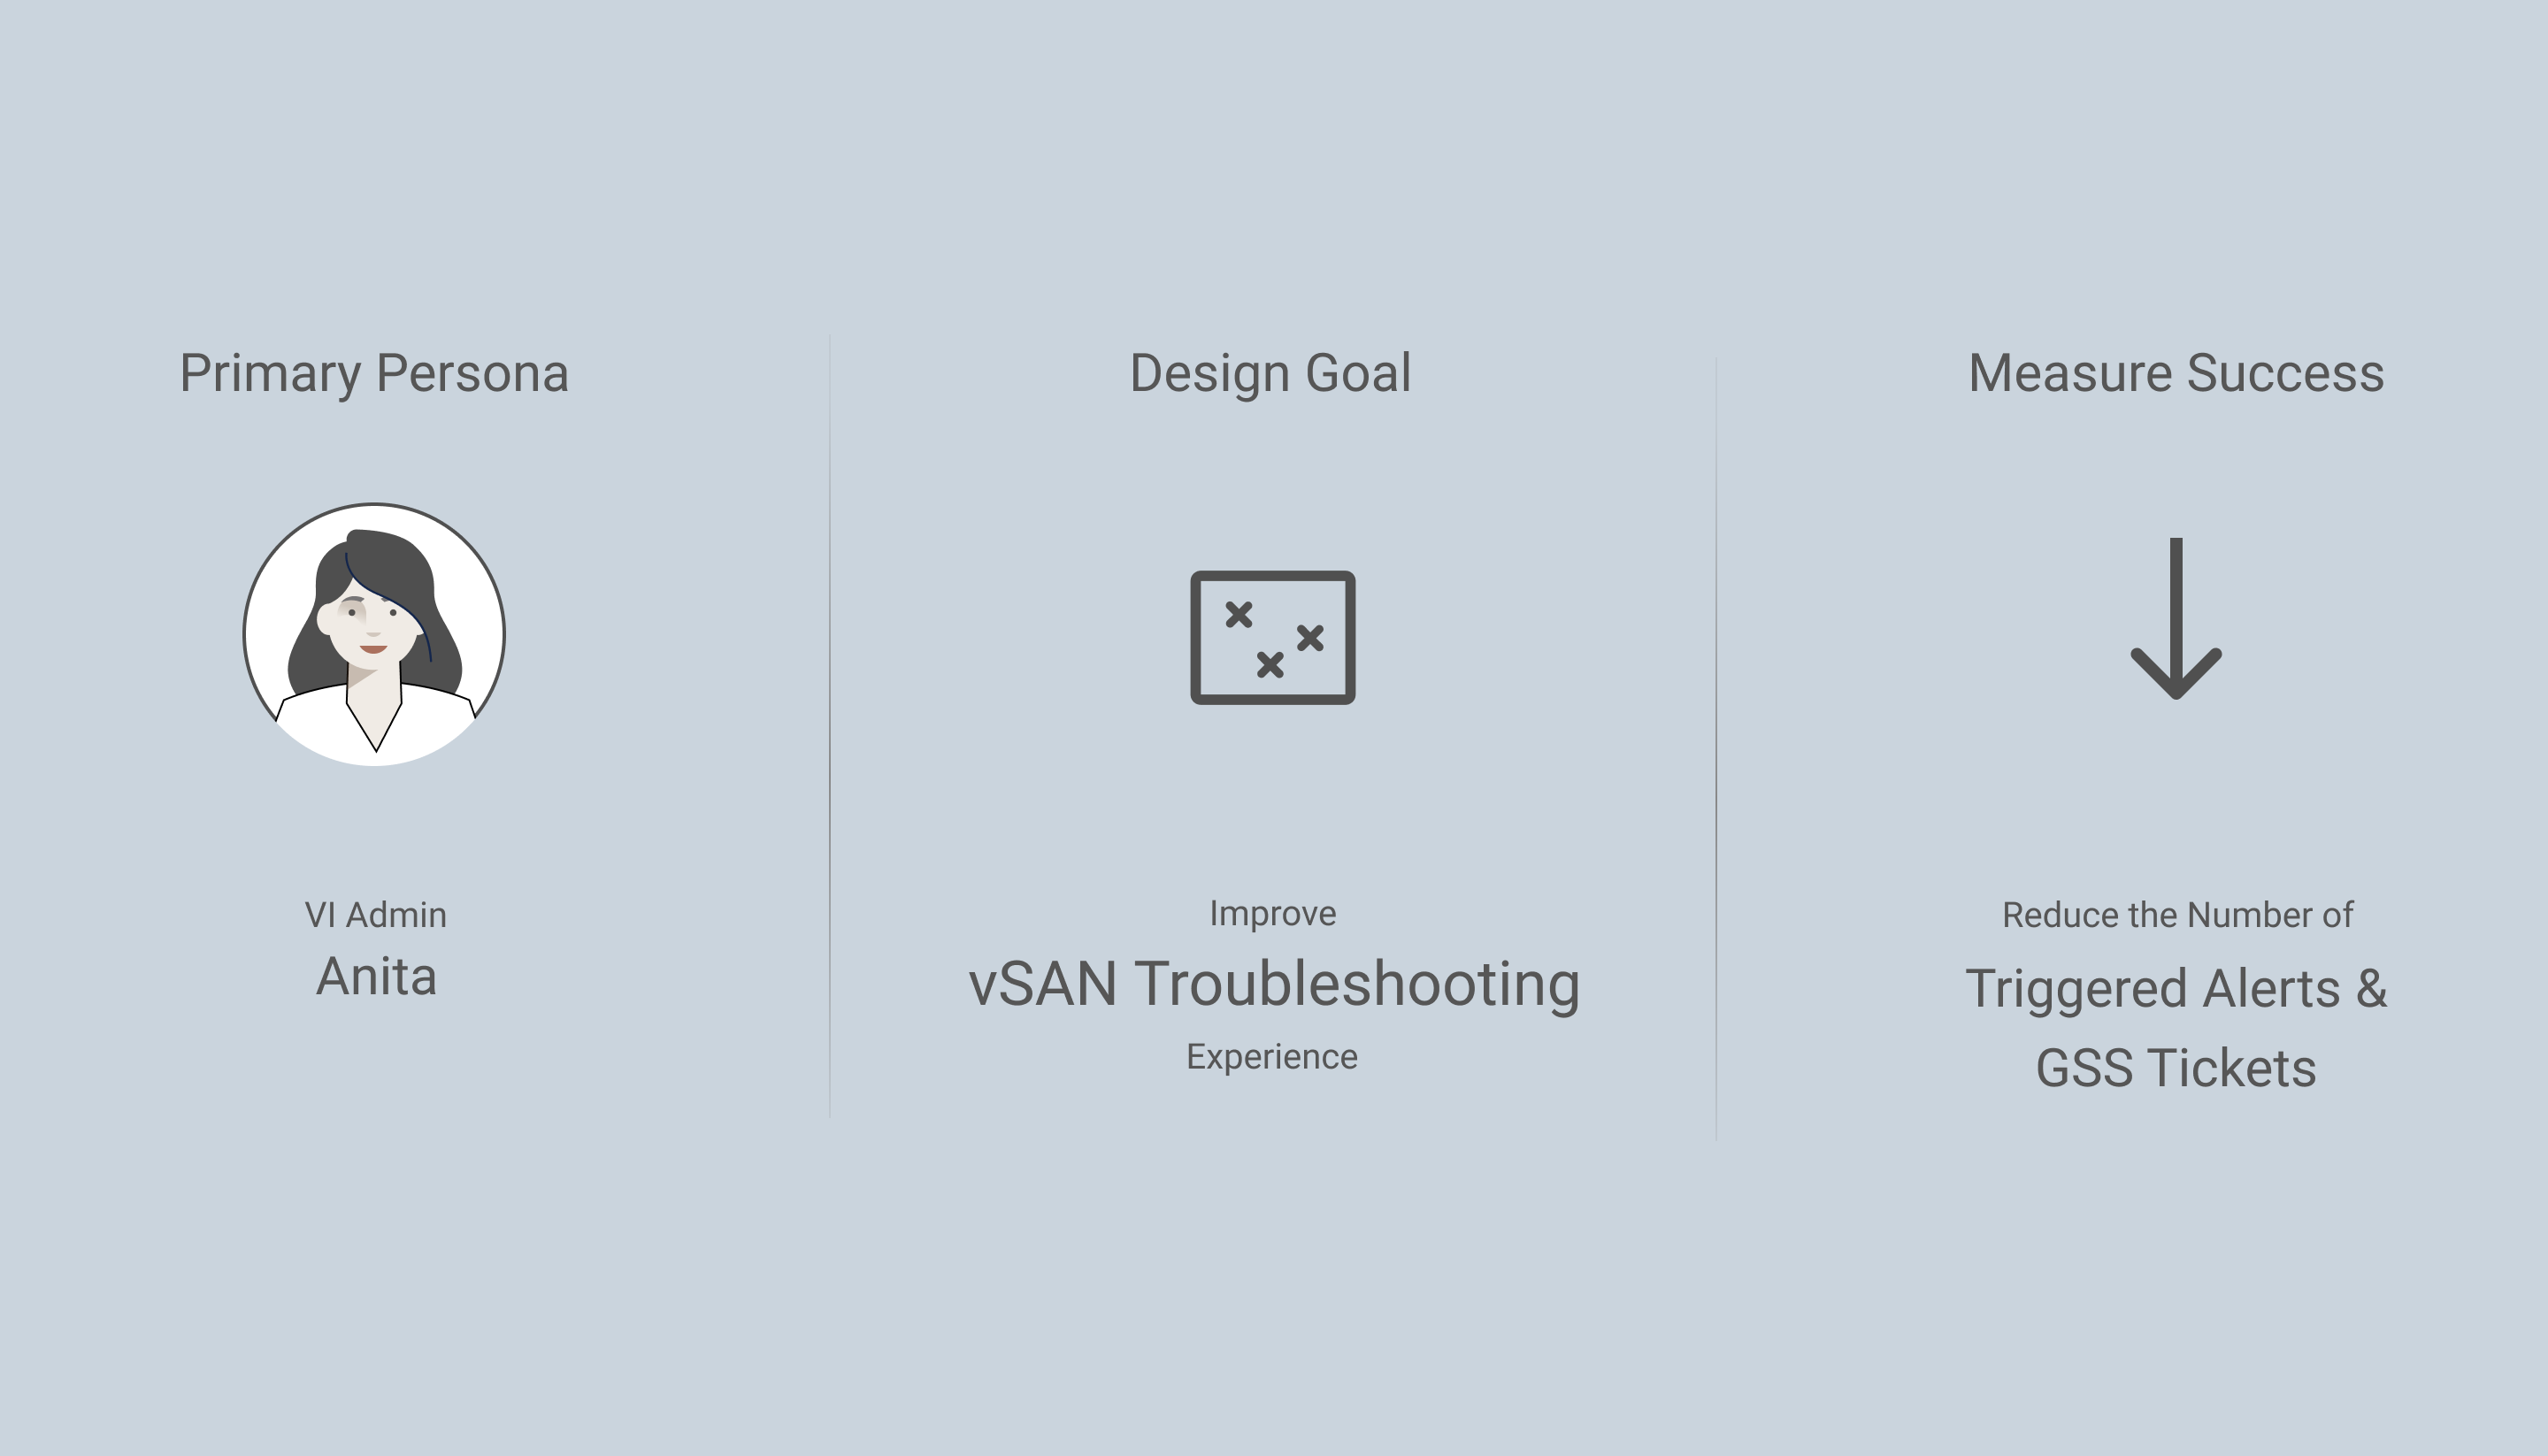
User Goal
How might we help our VI Admins get more visibility into their vSAN Clusters health?
Success Criteria
Reduce the number of Triggered Alerts & GSS (Global Support Services) Tickets
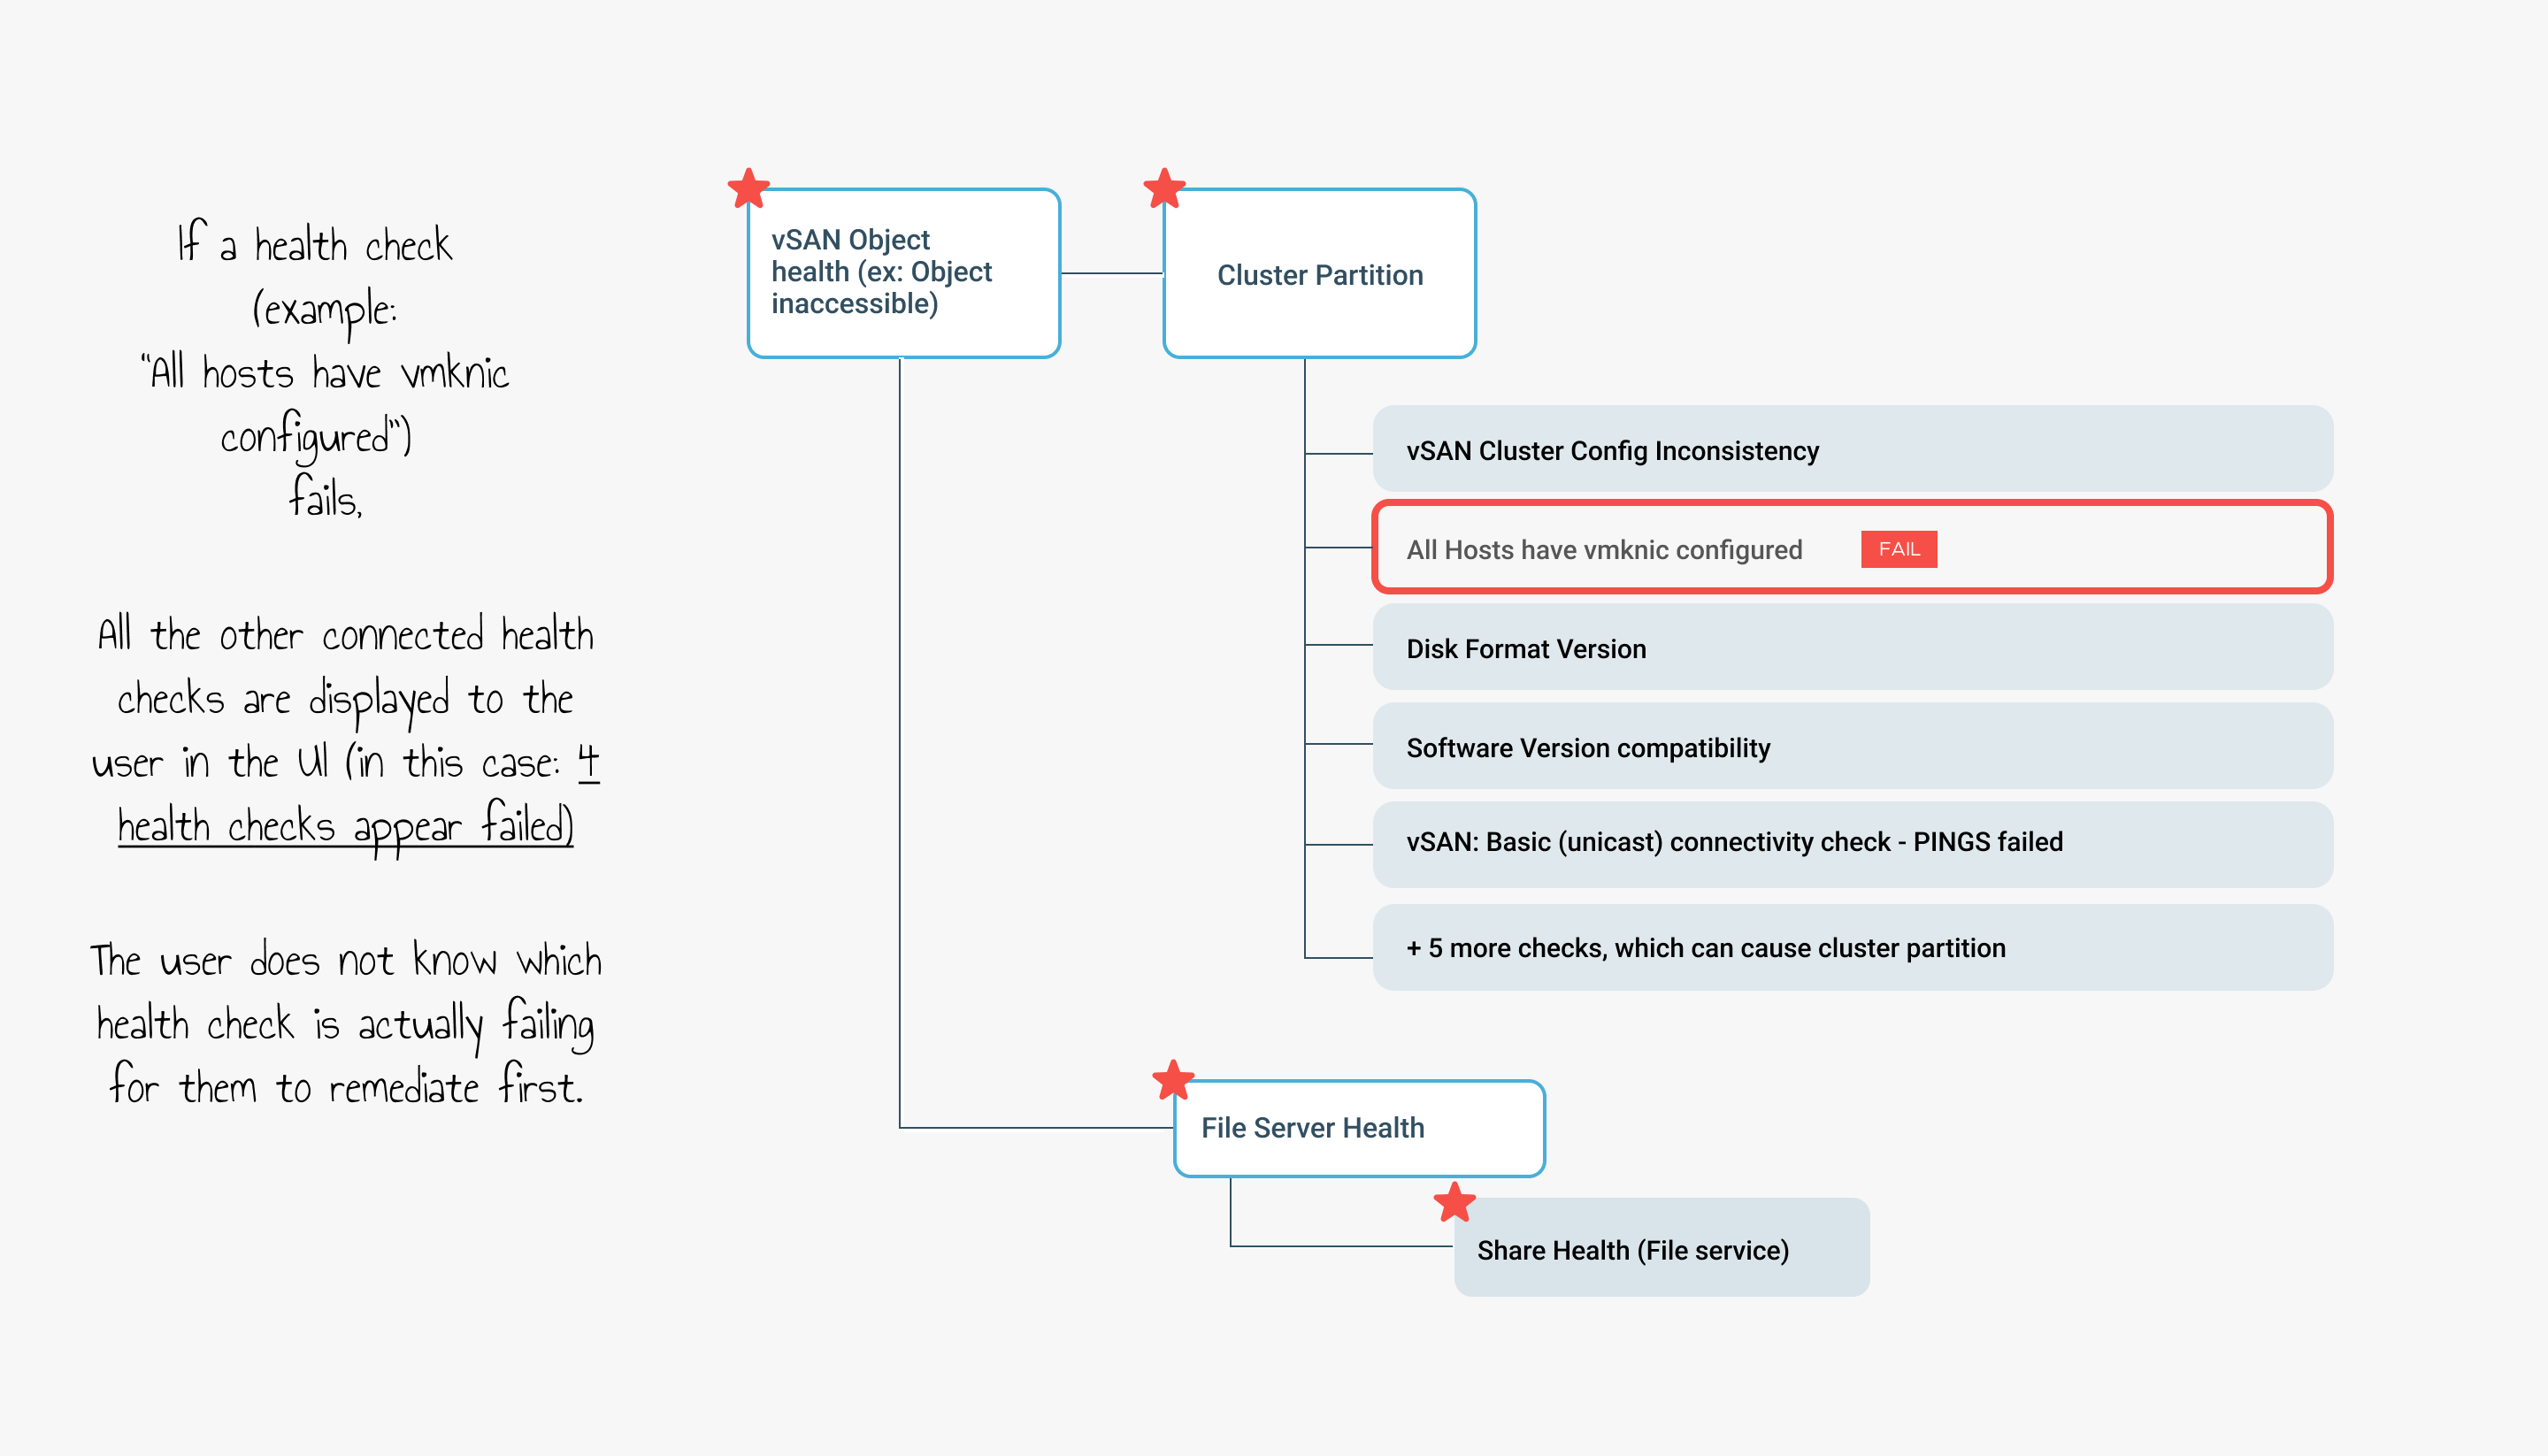
Internal Health Check Mapping
After talking to the engineering and architecture teams below is how the health checks have been mapped out
Core Pillars of User Responsibilities
Let us understand what matters the most to Anita. Some of the responsibilities she prioritizes (based on research data) are below:
1. Storage Availability
- Is the user data and management system available?
- Do I know if the data is protected?
2. Storage Performance
- Are the applications meeting performance requirements?
- How predictable is my performance?
3. Storage Efficiency
- Is this system meeting capacity requirements?
- Am I using my resources optimally?

Design Explorations
Several design explorations that were shared to receive cross-collaboration feedback (Click to enlarge)
Contextual Awareness
Pros
> Streamline Health Checks based on Anita’s roles
> Seamlessly Integrated Knowledge-Based Articles
Cons
> Reading these articles might be time-consuming
Data Visualization
Pros
> Health score
encouraging users to grasp the overall health
Cons
> Data Heavy
Easy Steps
Pros
> Traditional approach - guiding users through step-by-step to troubleshooting.
Cons
Too many clicks required to navigate and explore failed health checks
Finalized Design Options
After receiving team feedback, the 2 final options I created for user testing were:
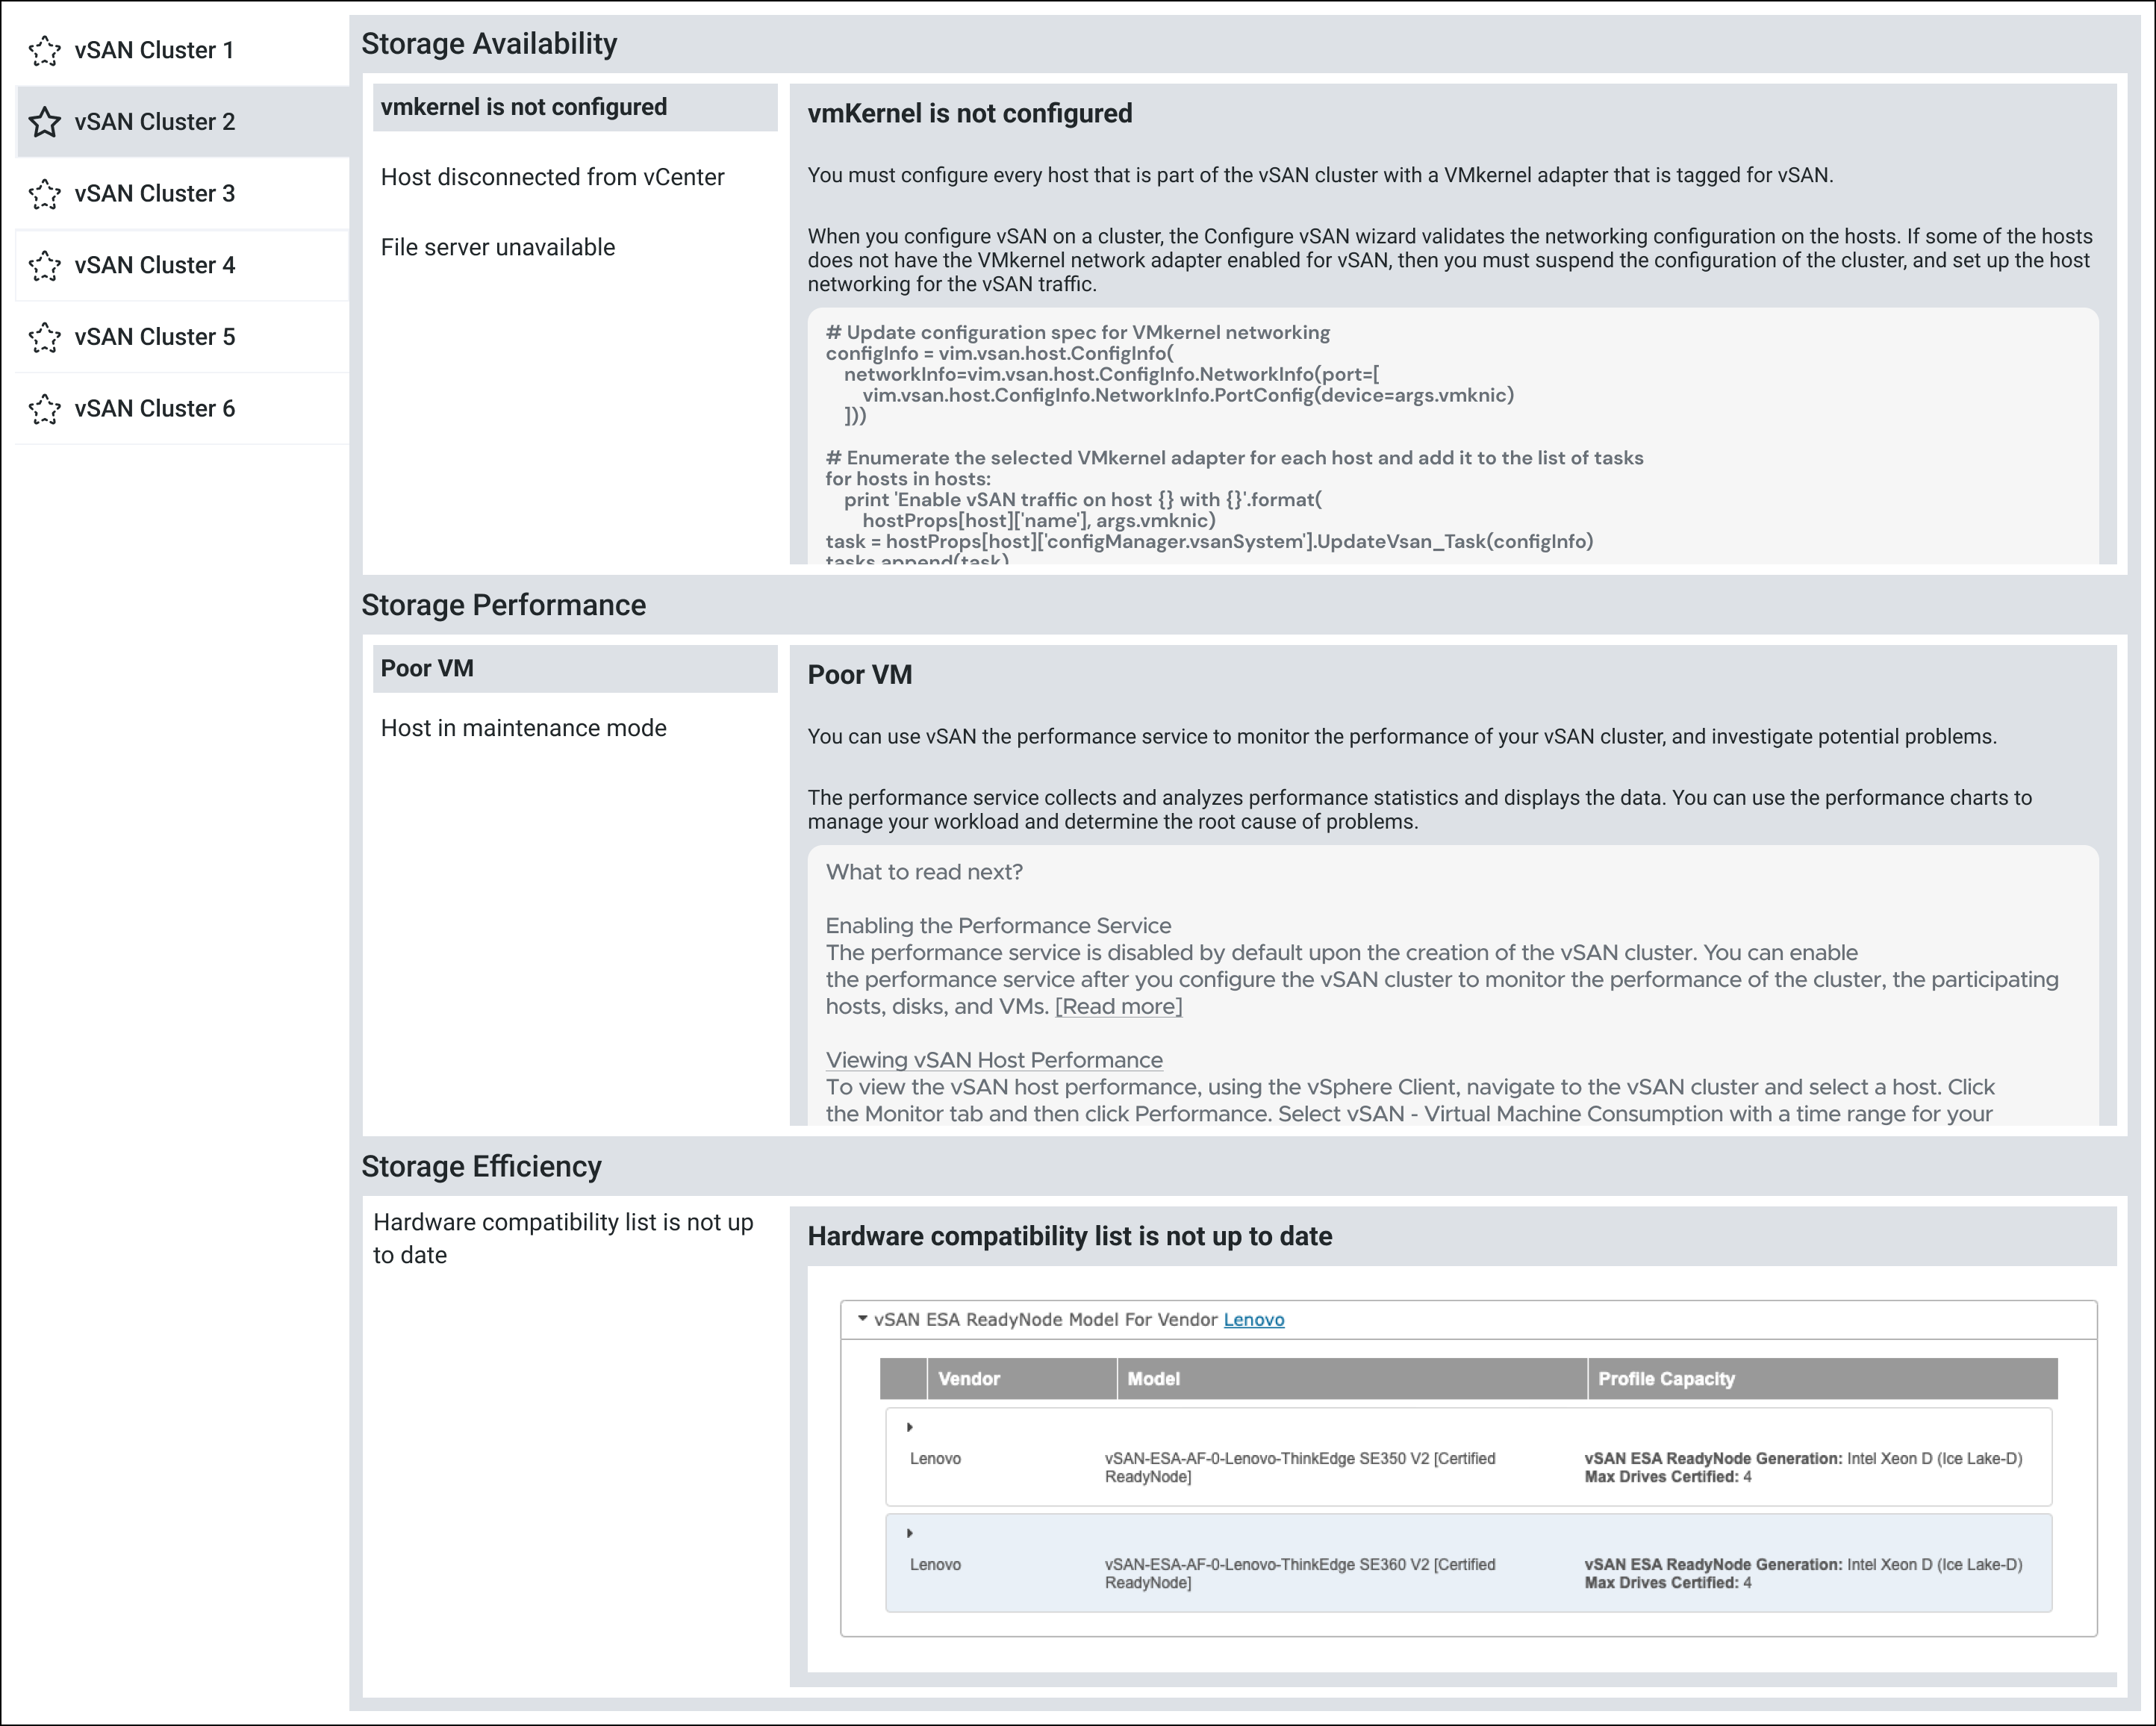
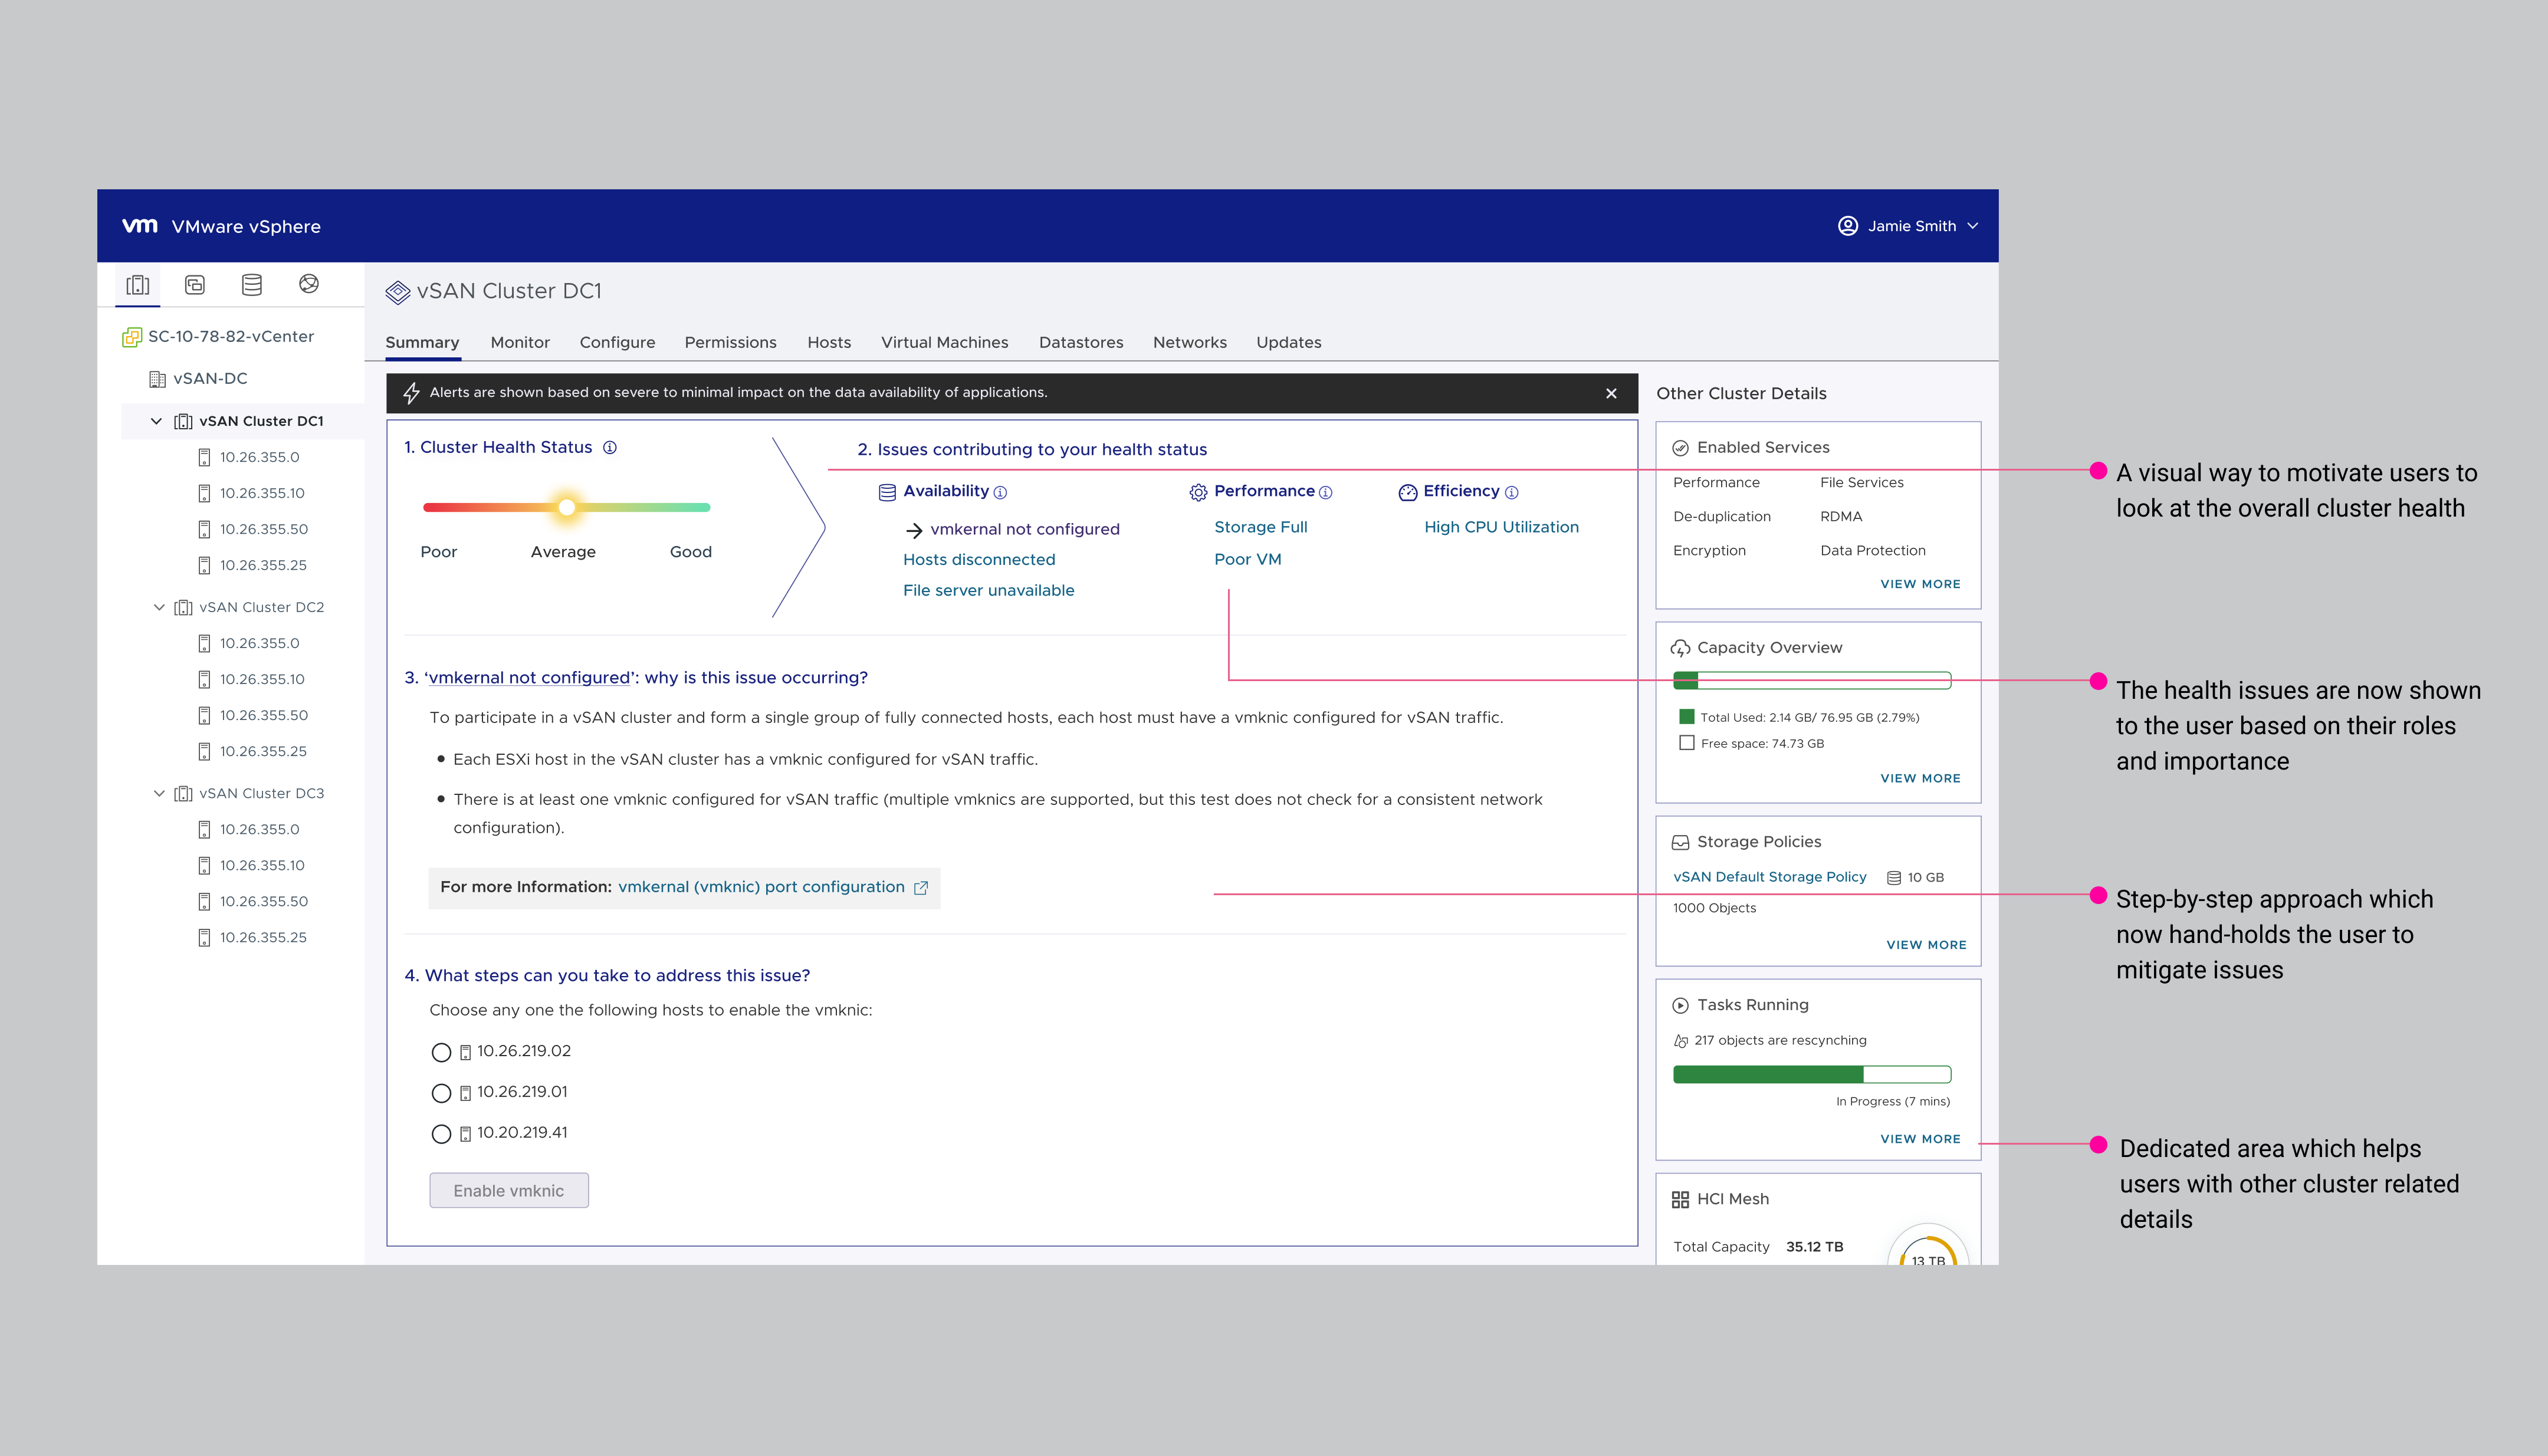
Option 1: Two Column Design
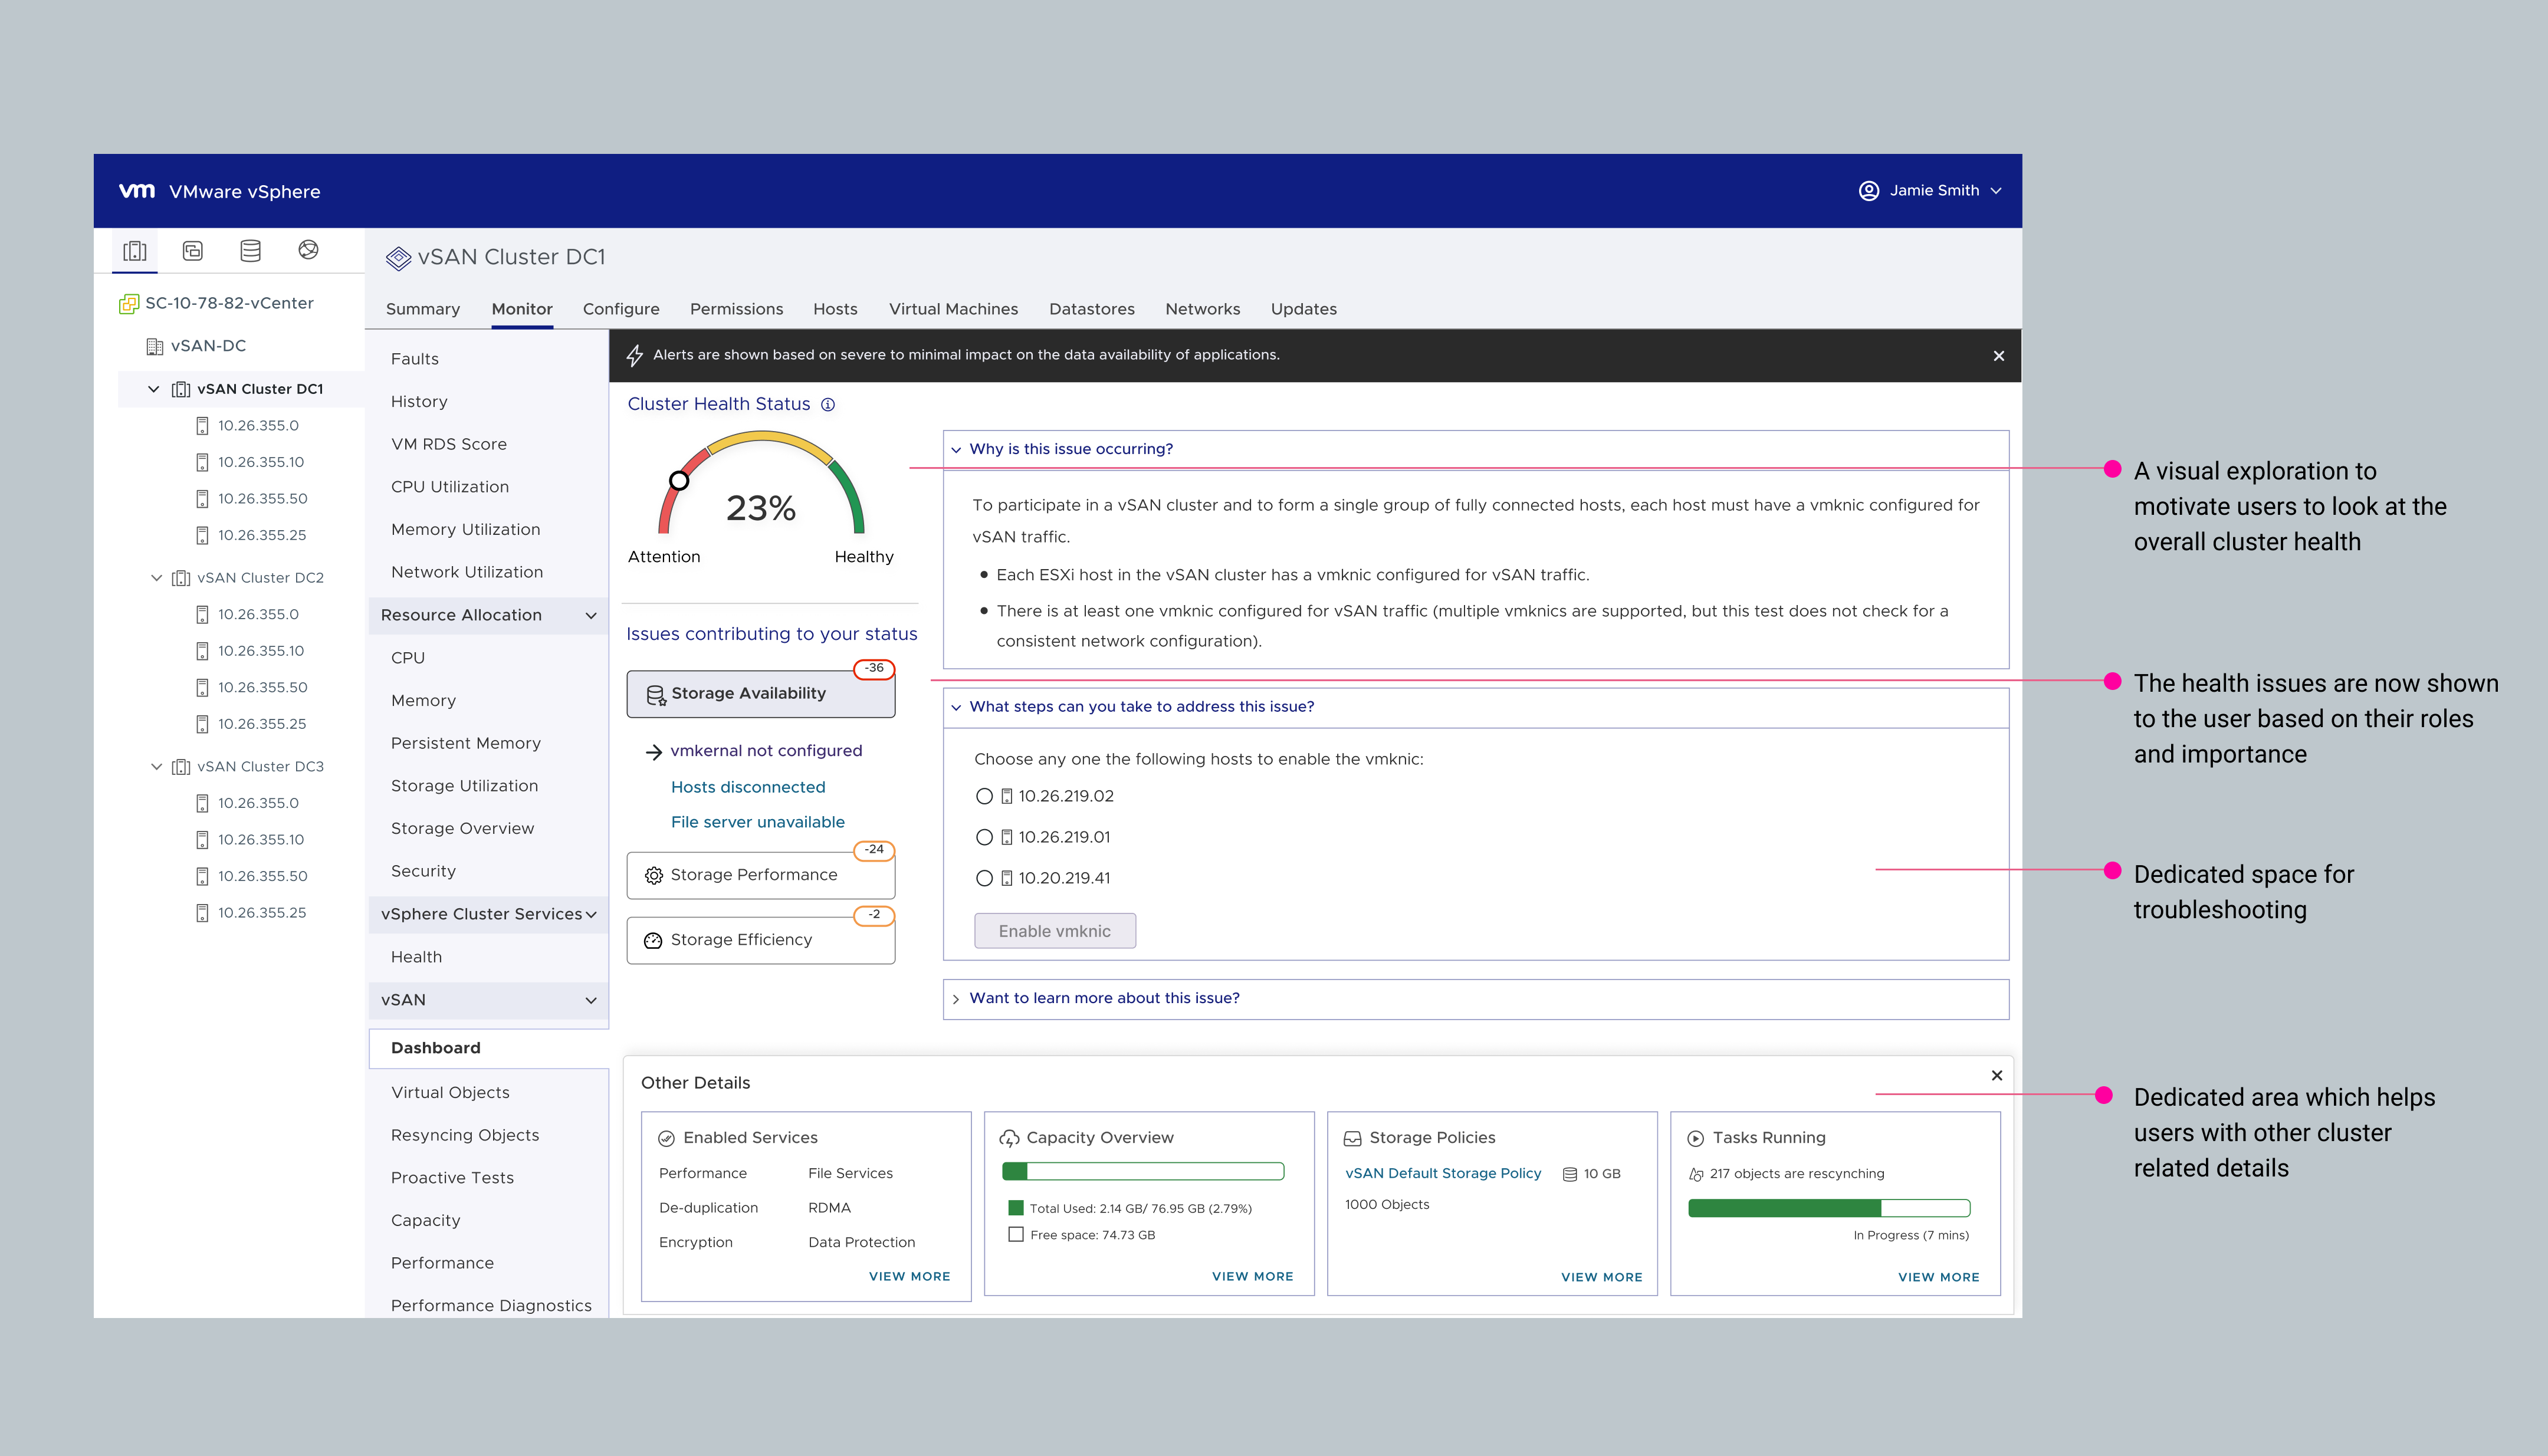
Option 2: Three Column Design
User Research
Selection Criteria:
- Medium to Large Customers
- 1+ vSAN Cluster
- Using vSAN > 1 Year
- Using vSAN 6.0+
- Design Studio Newsletter
Users Tested
- 12 VI Admins Across Multiple Continents
User Research
Selection Criteria:
- Medium to Large Customers
- 1+ vSAN Cluster
- Using vSAN > 1 Year
- Using vSAN 6.0+
- Design Studio Newsletter
Users Tested
- 12 VI Admins Across Multiple Continents
User Research
Selection Criteria:
- Medium to Large Customers
- 1+ vSAN Cluster
- Using vSAN > 1 Year
- Using vSAN 6.0+
- Design Studio Newsletter
Users Tested
- 12 VI Admins Across Multiple Continents
Research Download
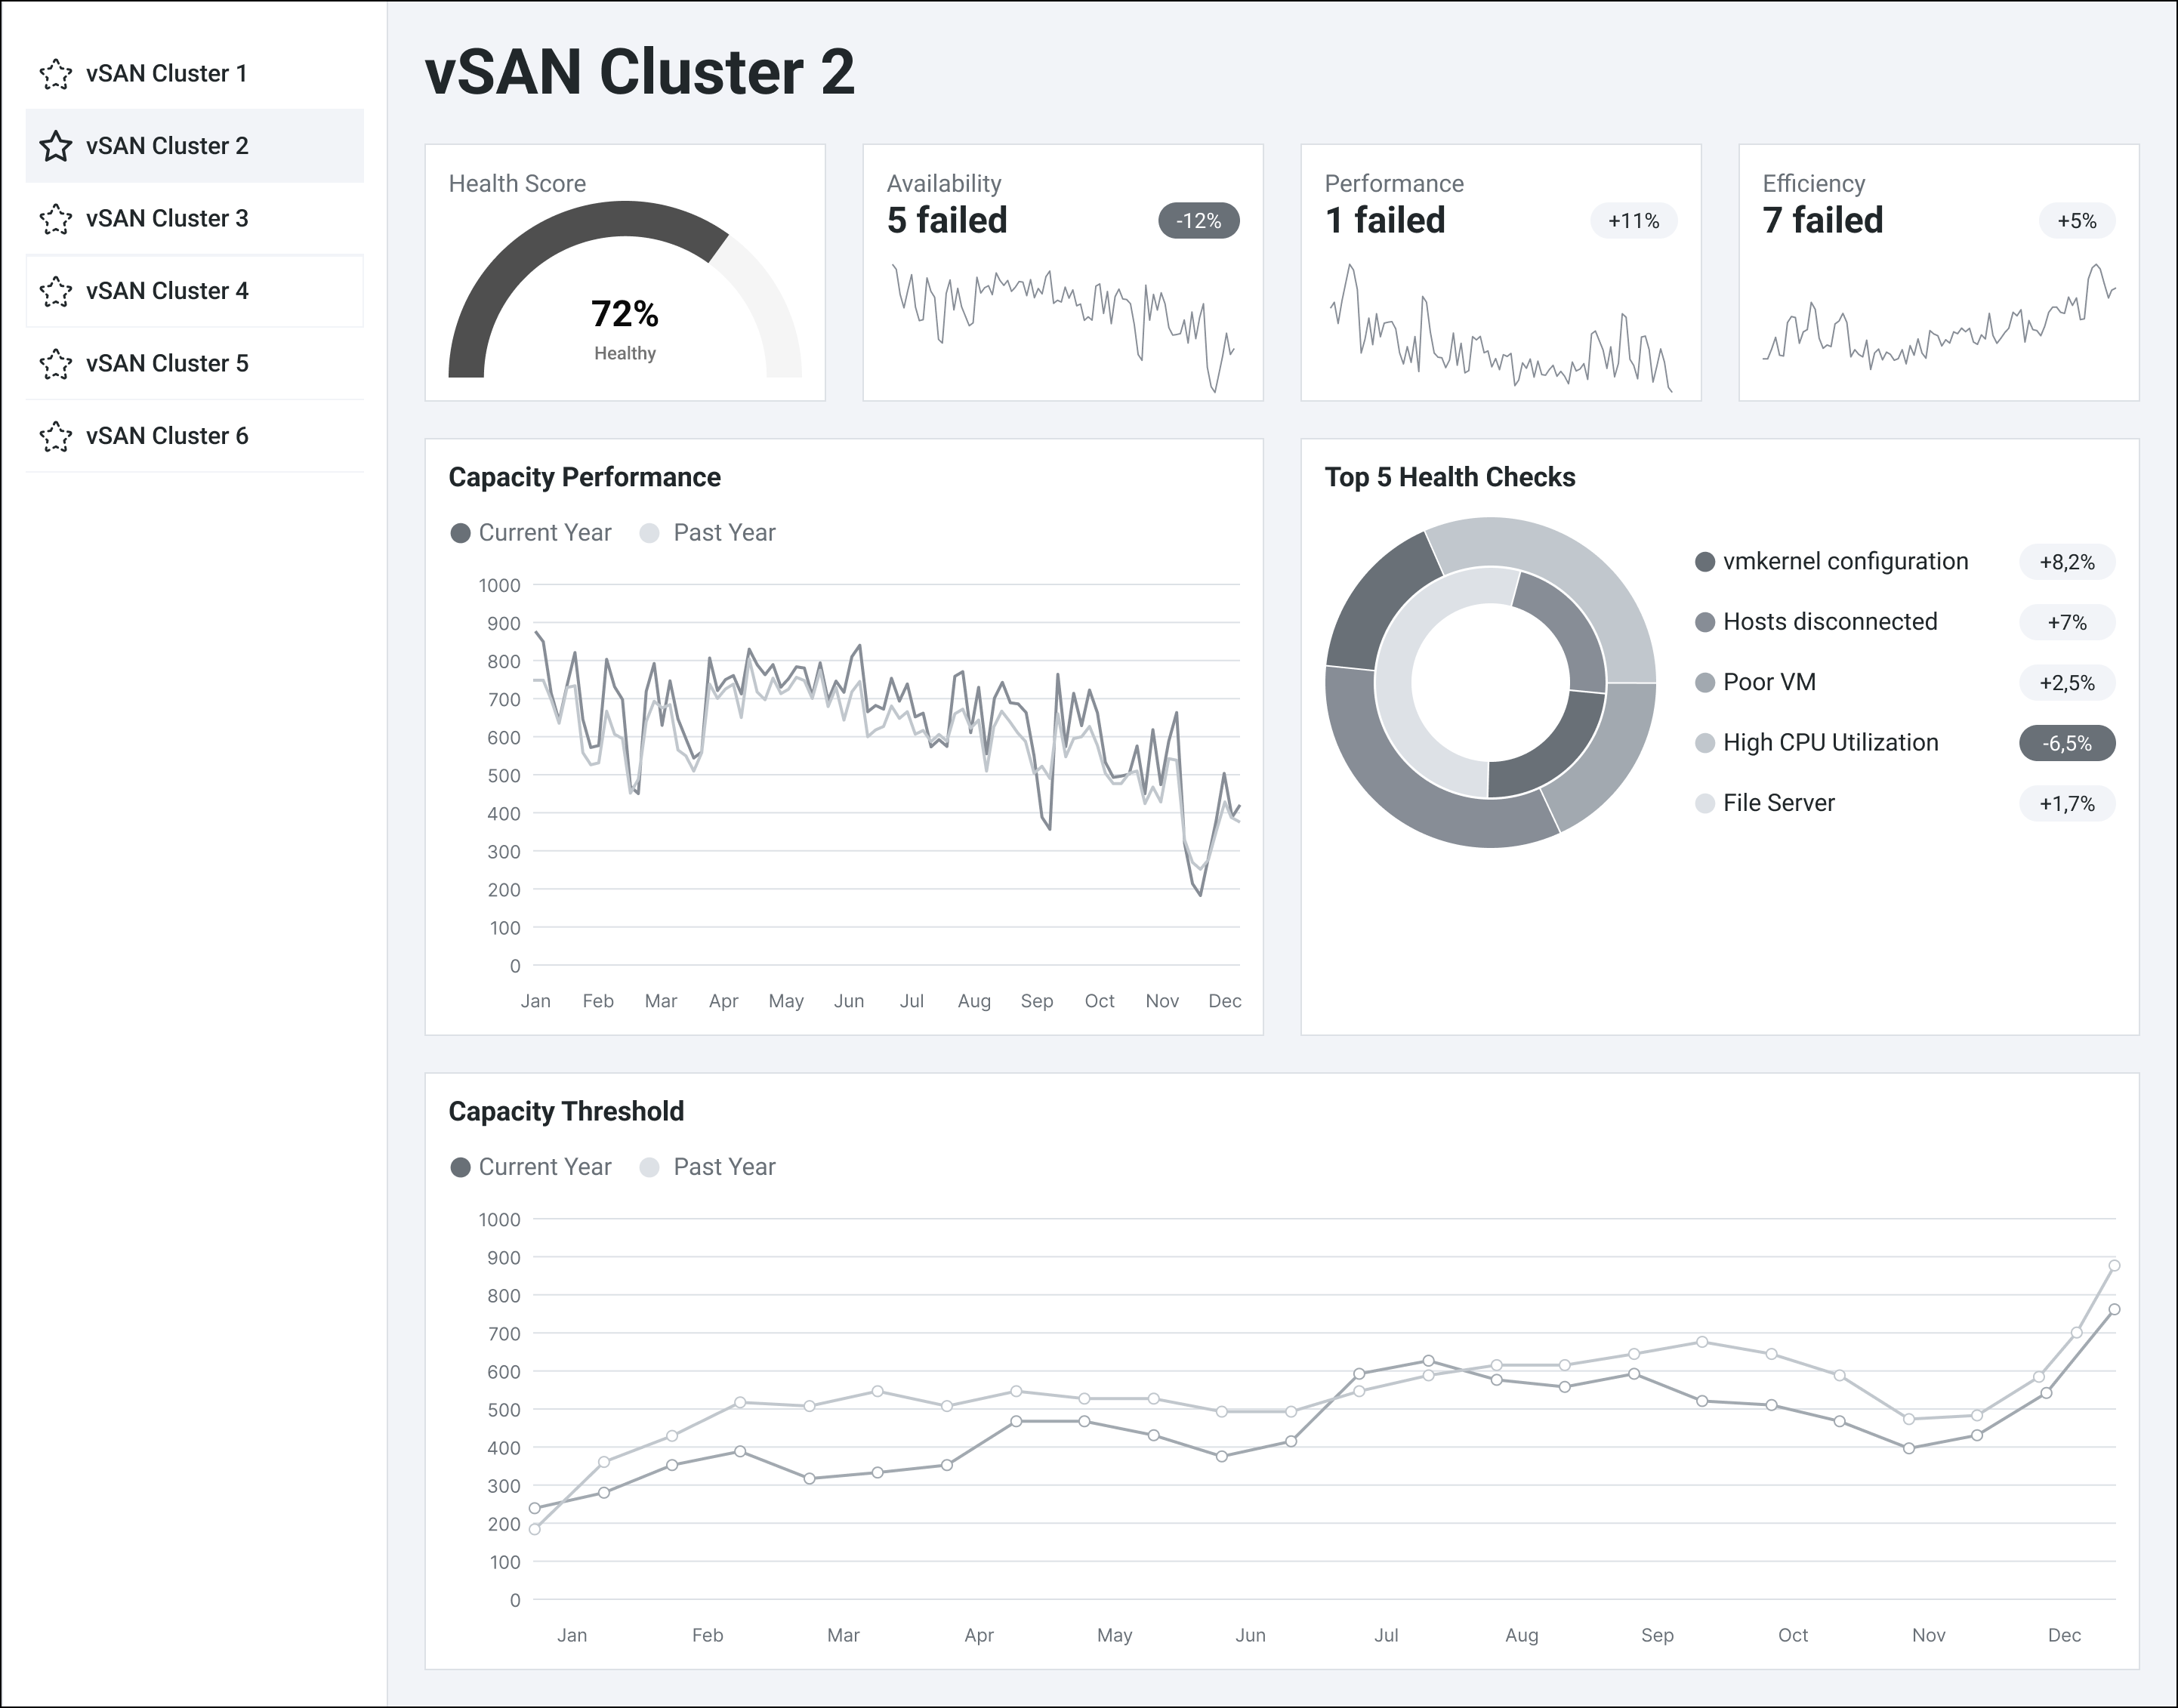
Health Score Dial vs. Health Status Line
- 90% users interacted with the line visualization which made them feel they could interact with it to bring their Health status to green.
- Almost everyone prefered the dial visual representation since they have seen and/or used it in other products.
Health Check Categories
- Some users were confused by the numbers over each category. For them, it represented the number of failed health checks in each category.
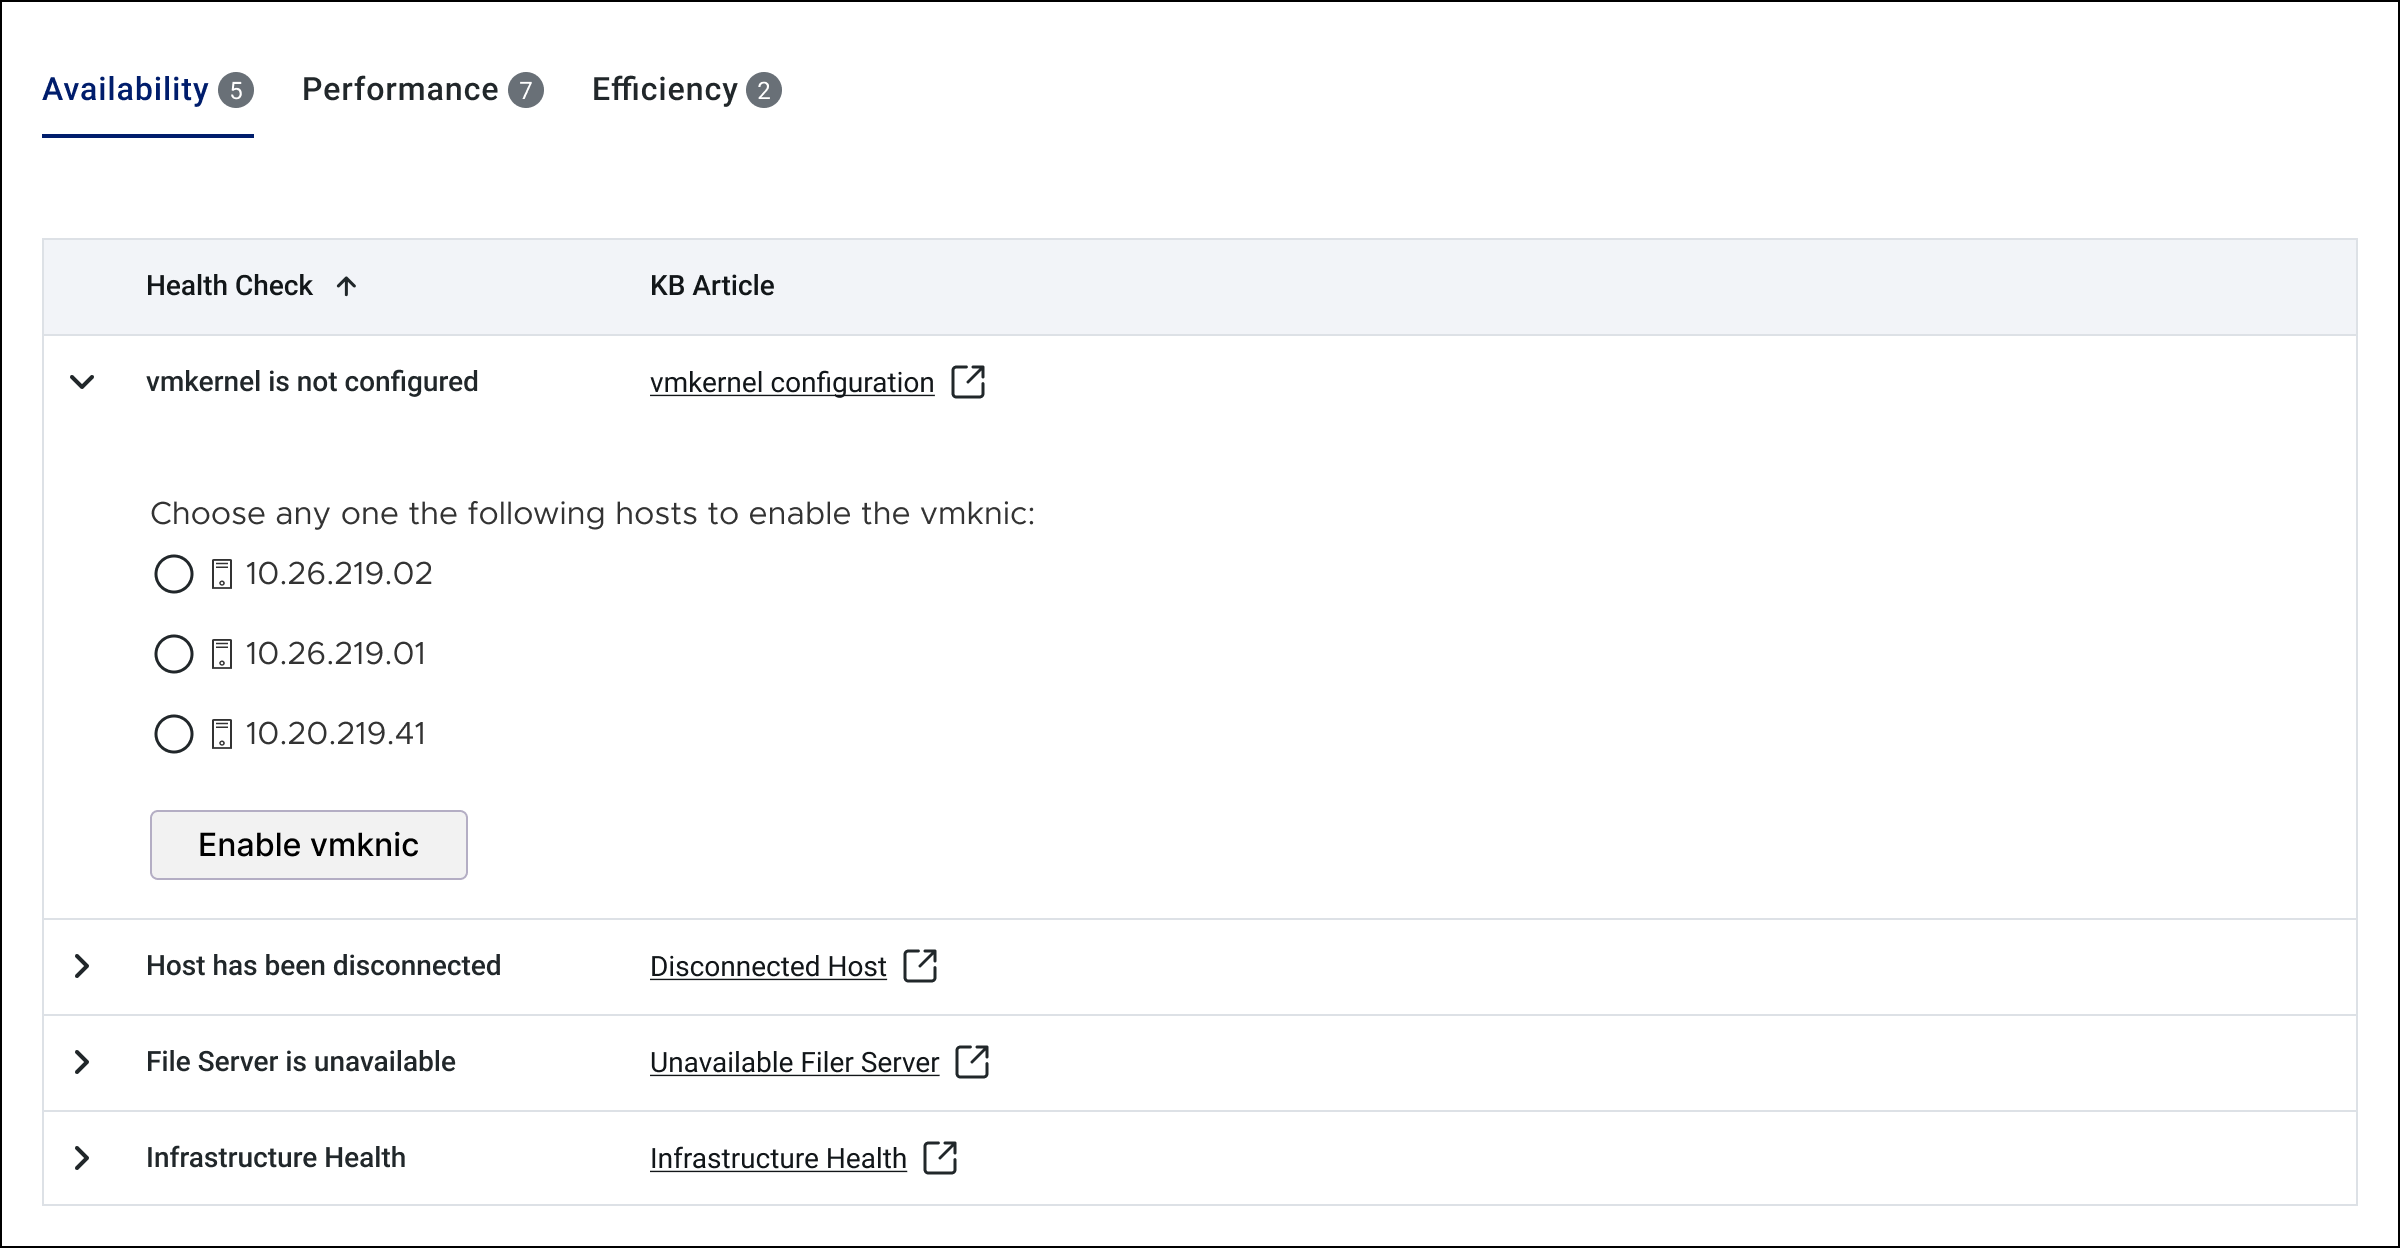
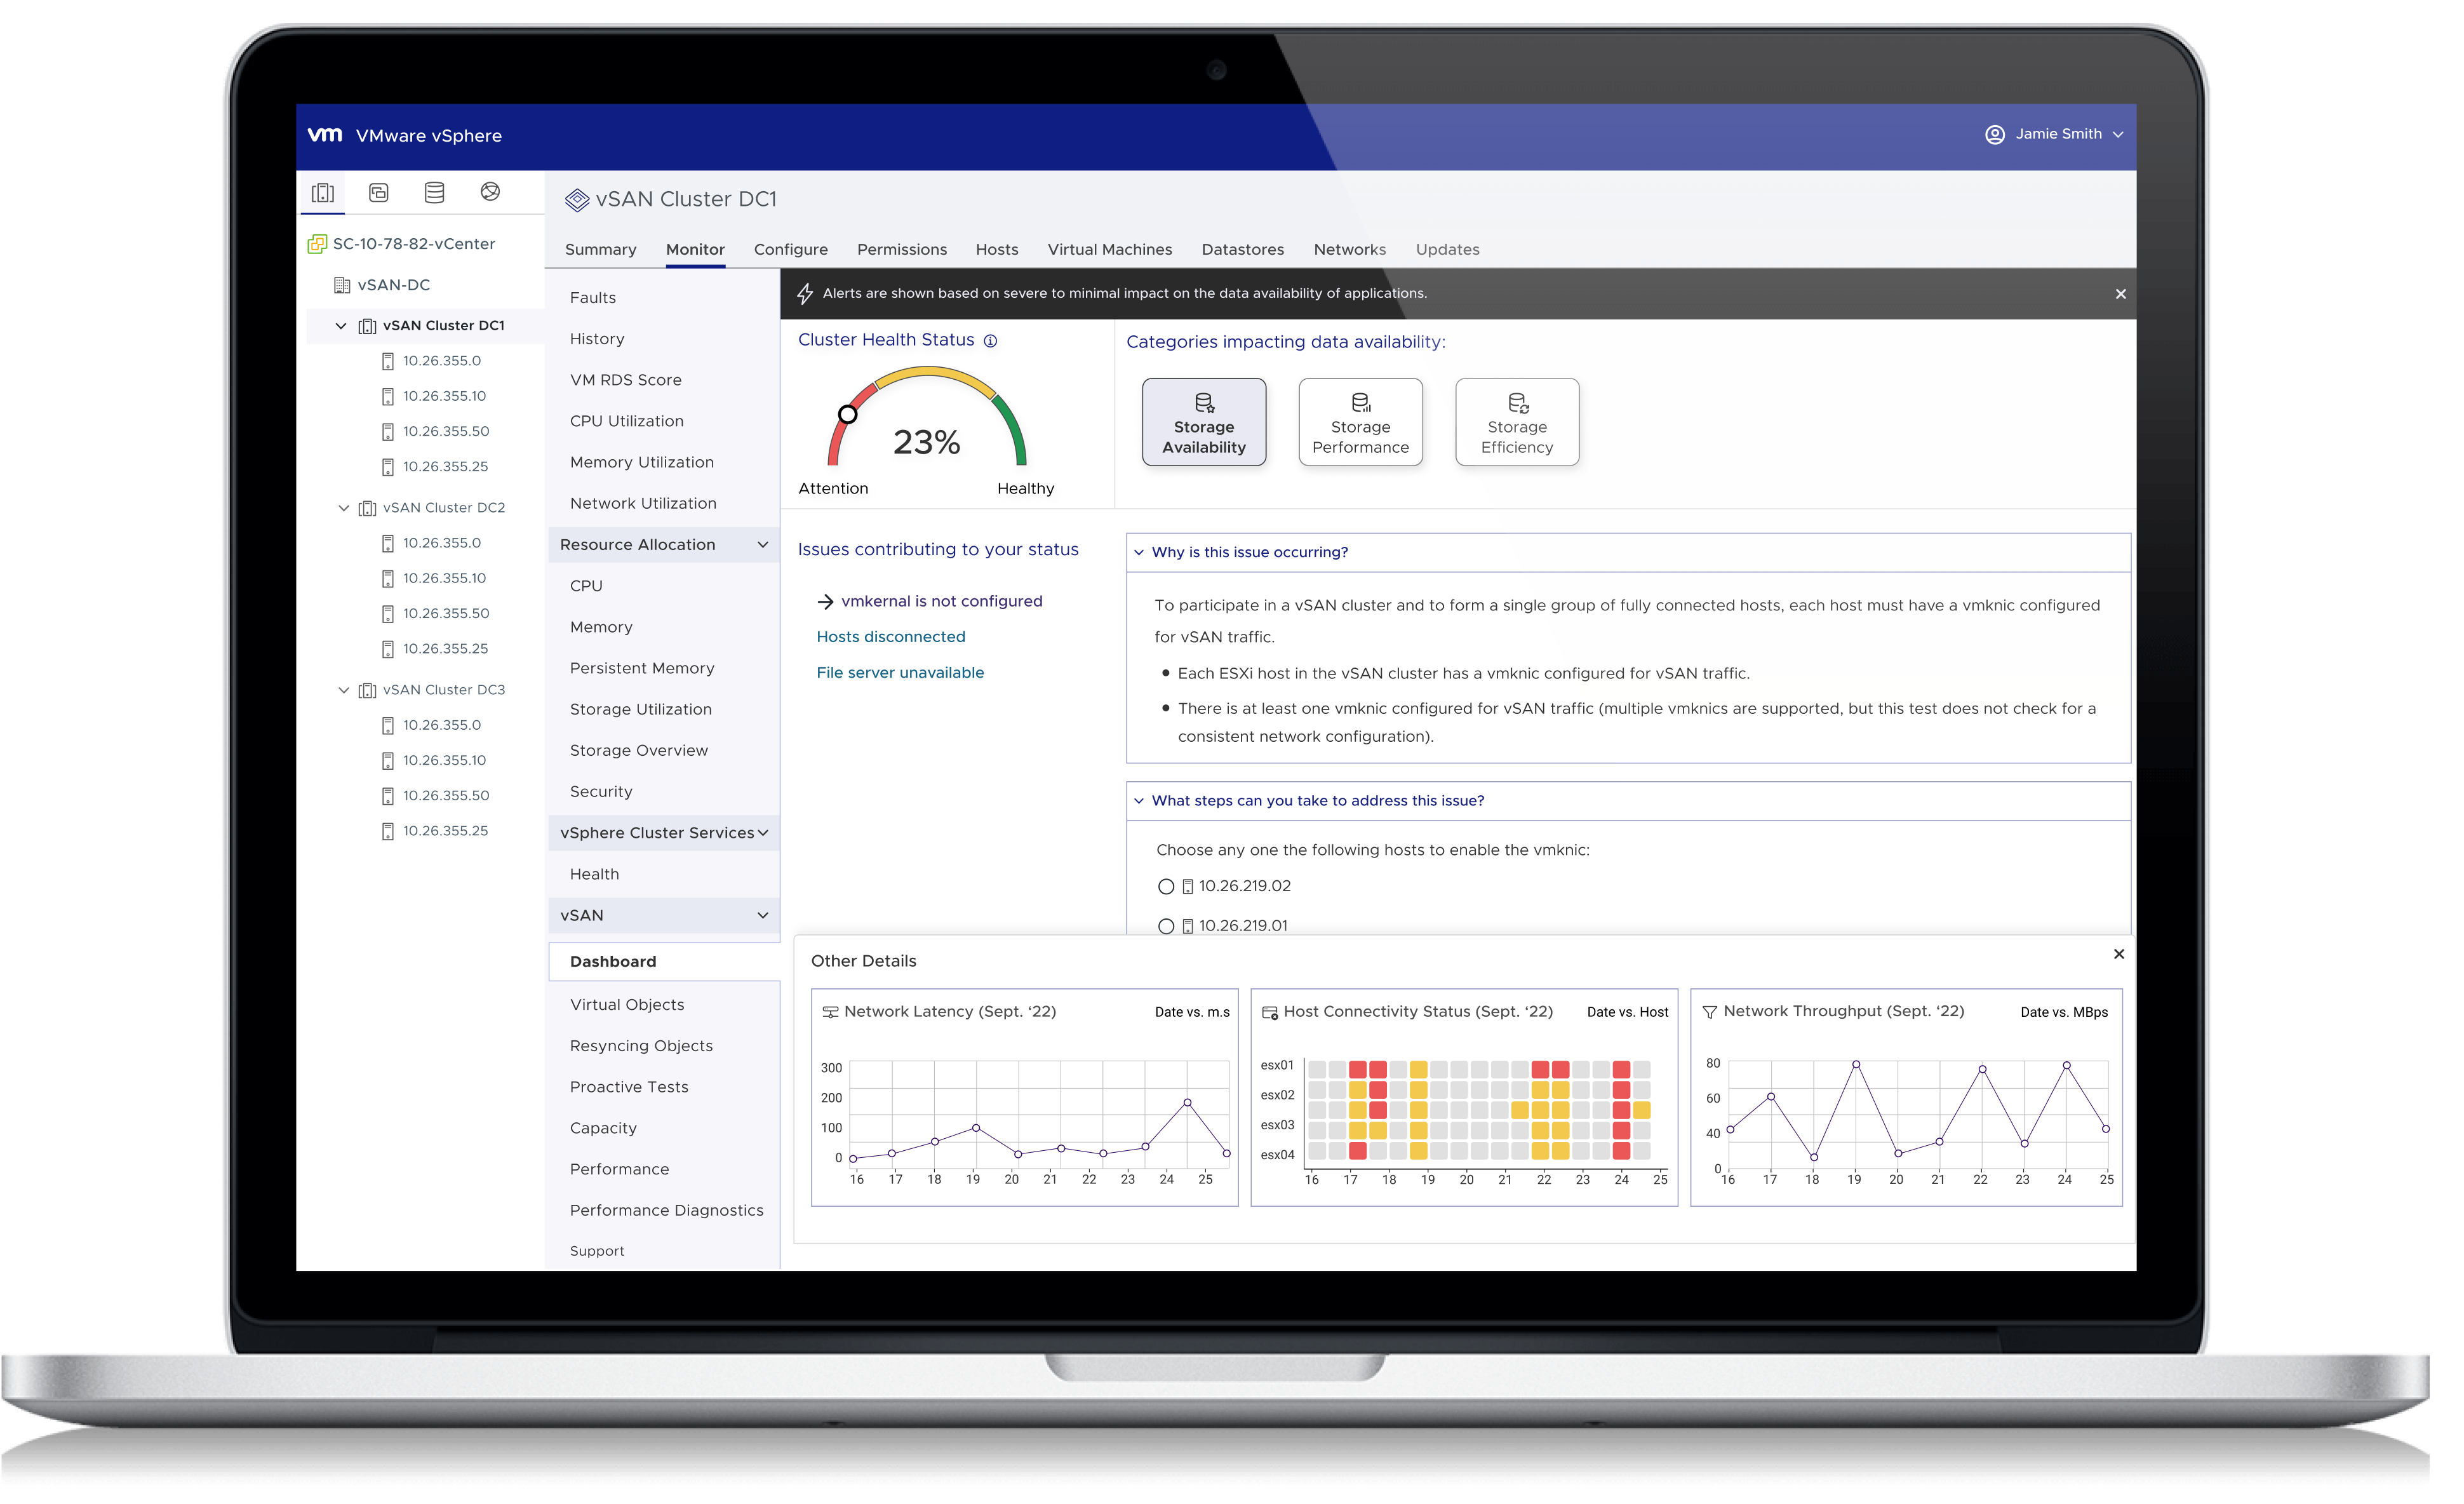
Final Design For MVP
Summary