Data Visualization
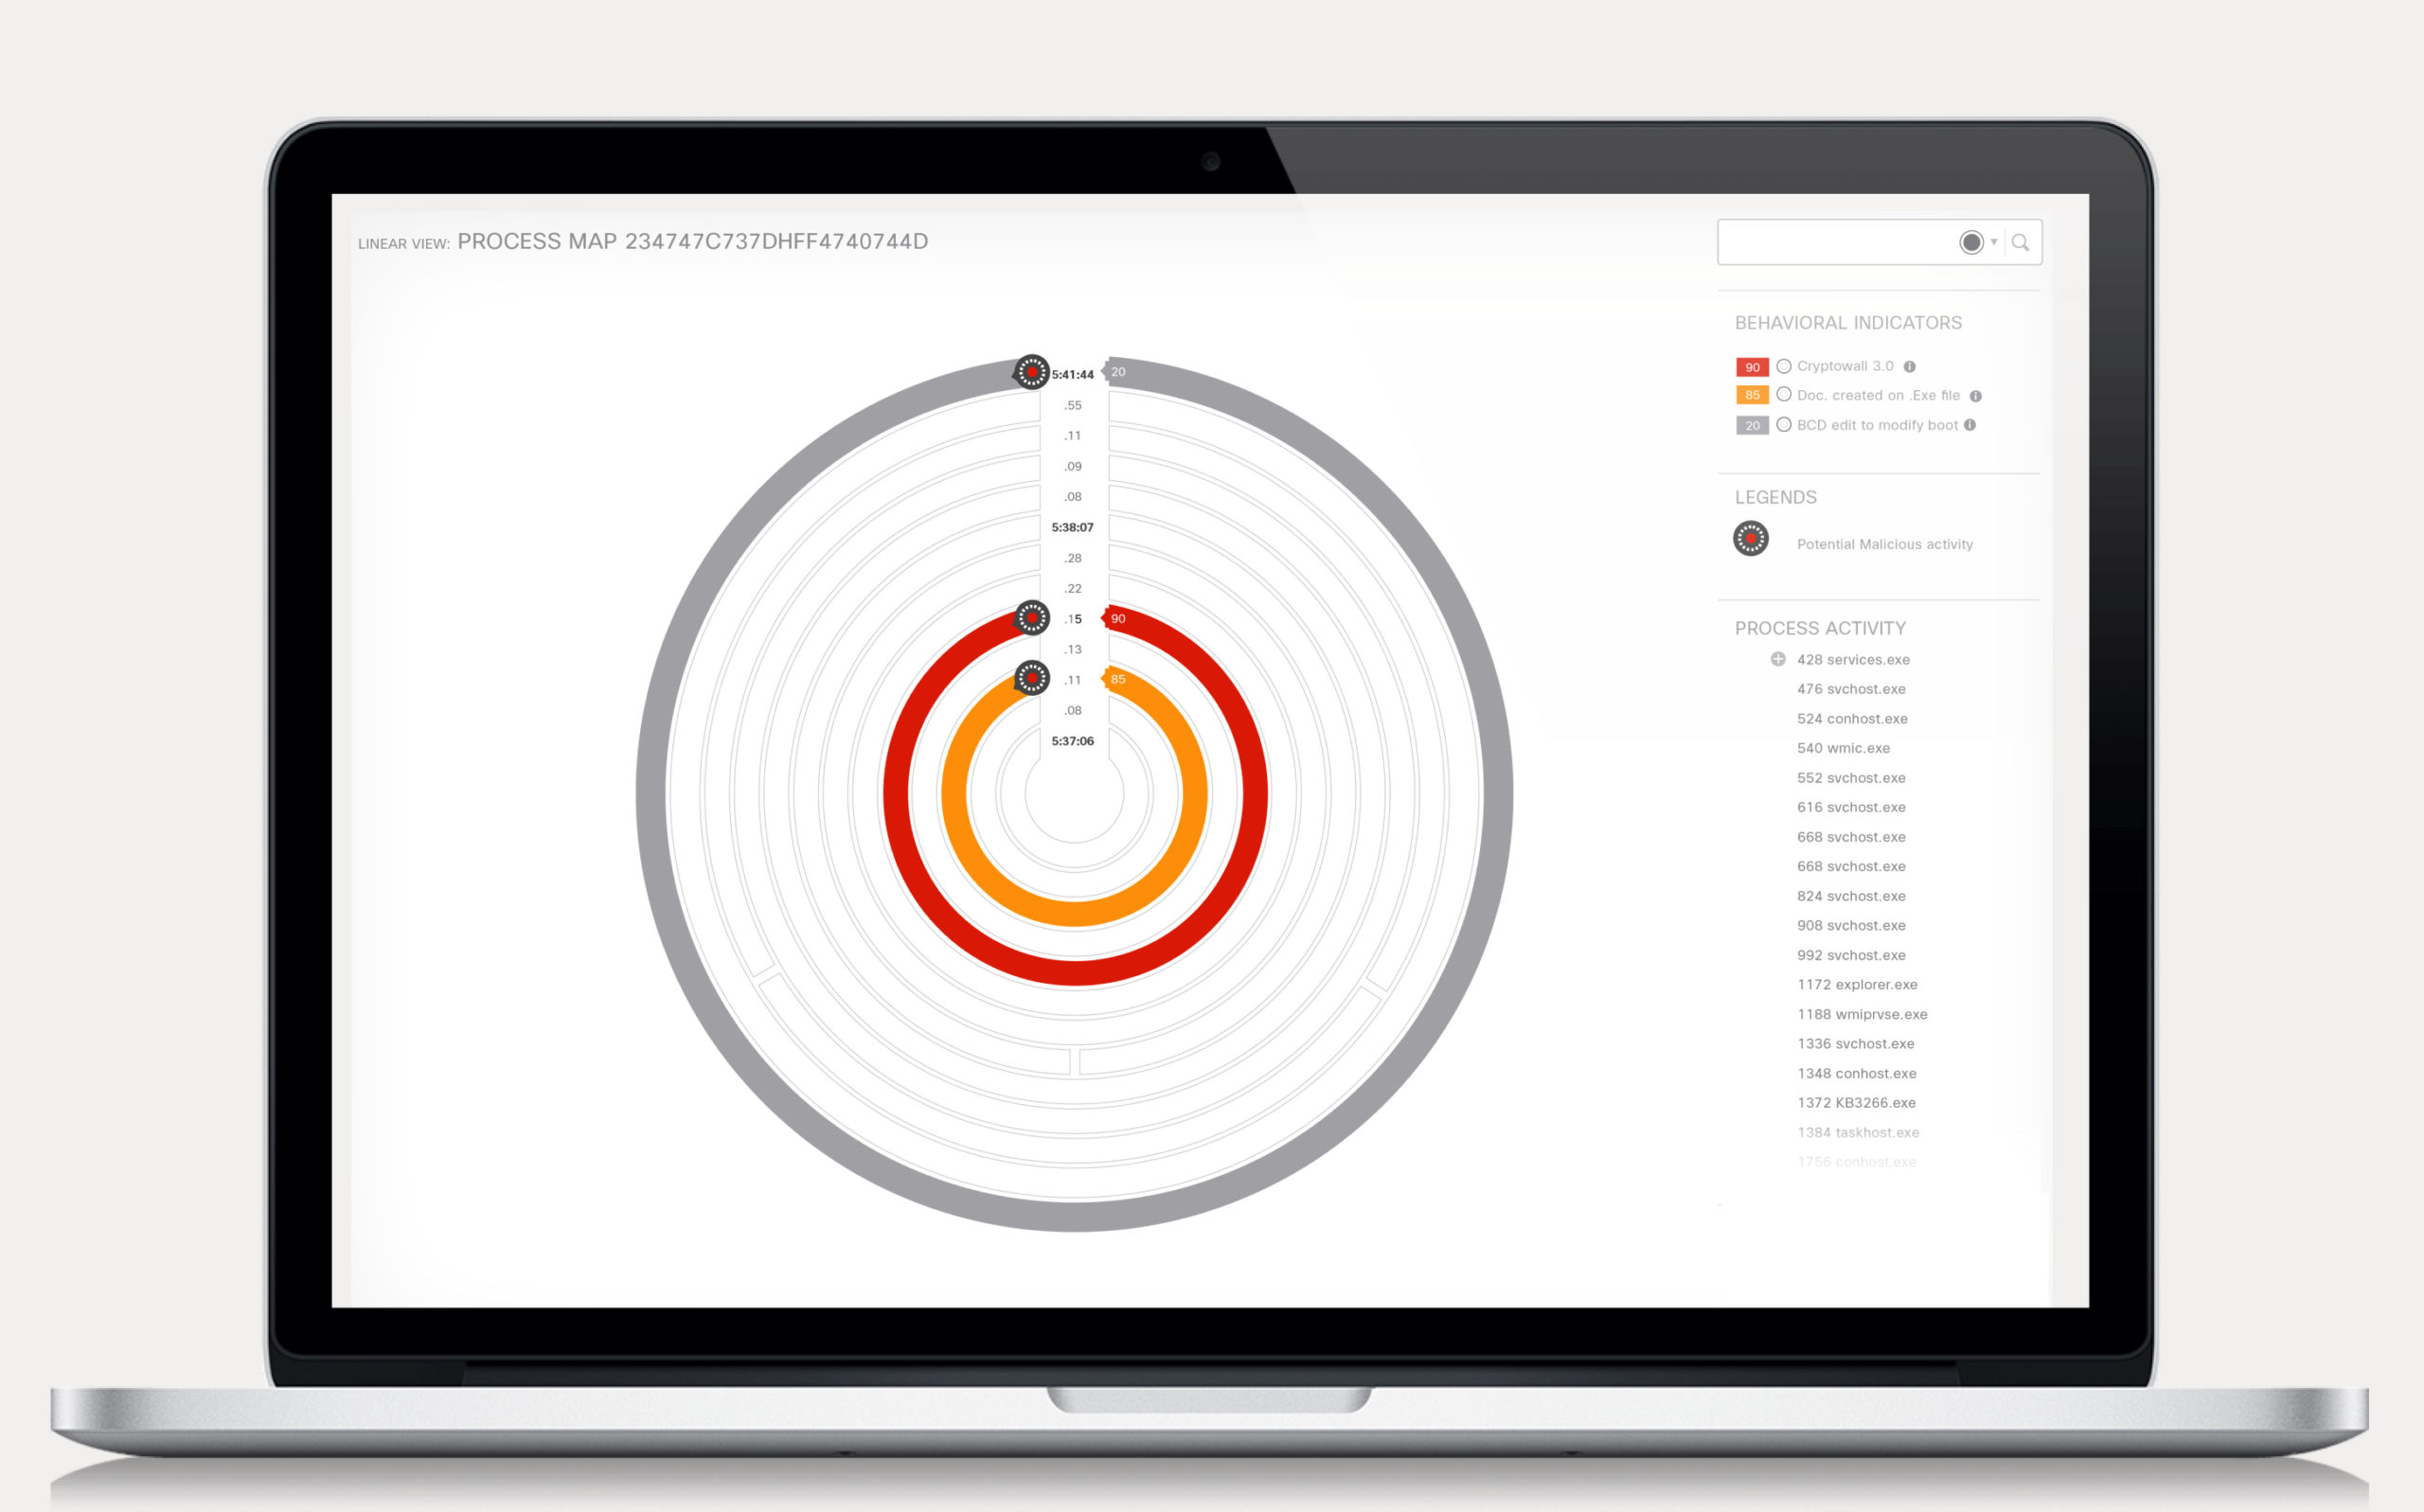
This product combines sandboxing and threat intelligence into one unified solution to protect organizations from malware. With robust and context-rich data visualization, it is easy for network investigators to quickly understand if there is a malware and what the malware is doing (or attempting to do), how large a threat it poses, and how to defend against it.
My Role
Lead Product Designer
Company
Cisco Systems
Background

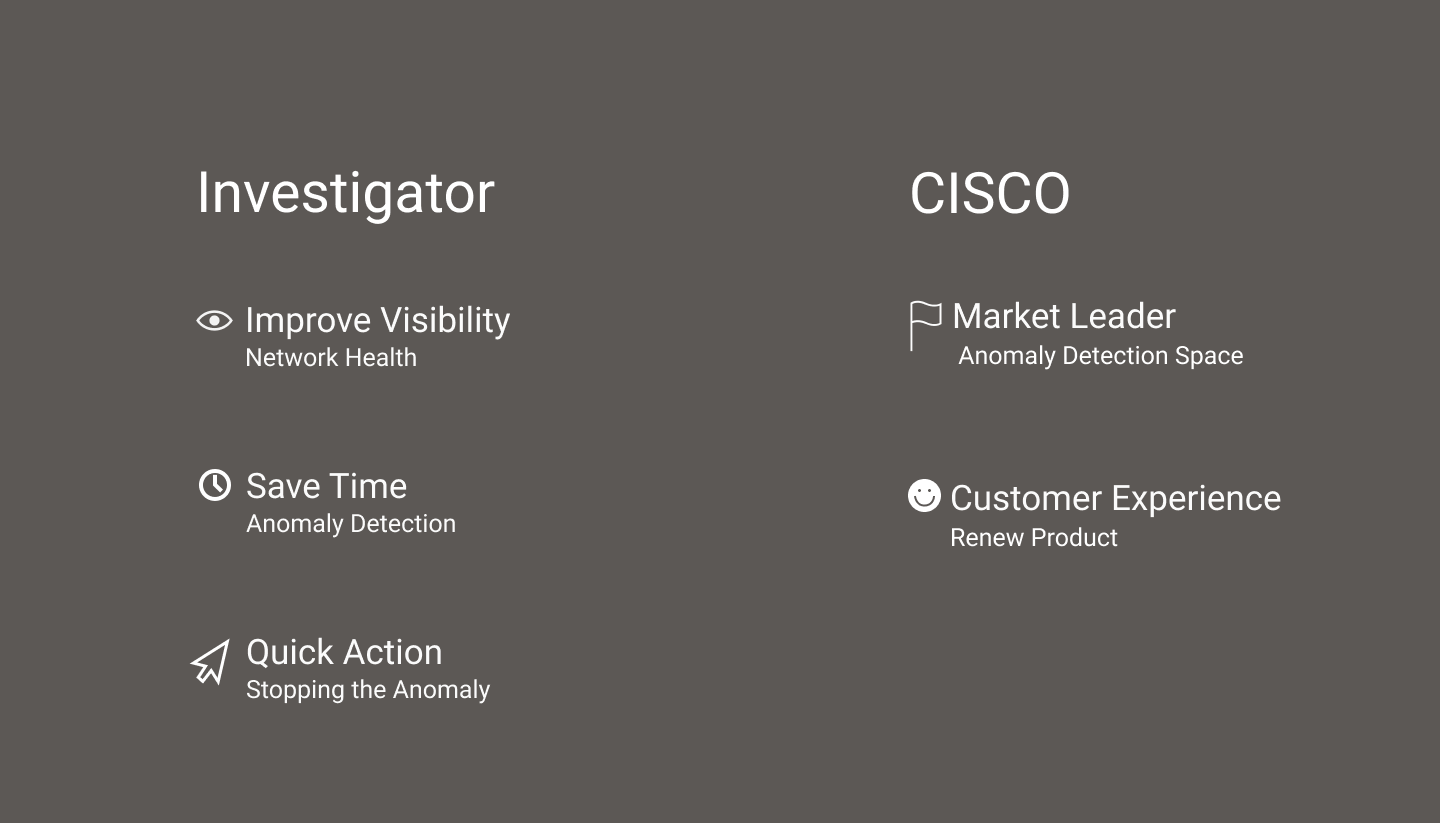
Setting The Stage
Goal
Existing Design

The current product was very hard to use.
No clear starting point for the user to start their analysis.
Cognitive load by giving alot of information to the users.
No clear understanding of what kind of anomalies does this file have and how do they map to the behavioral indicators.
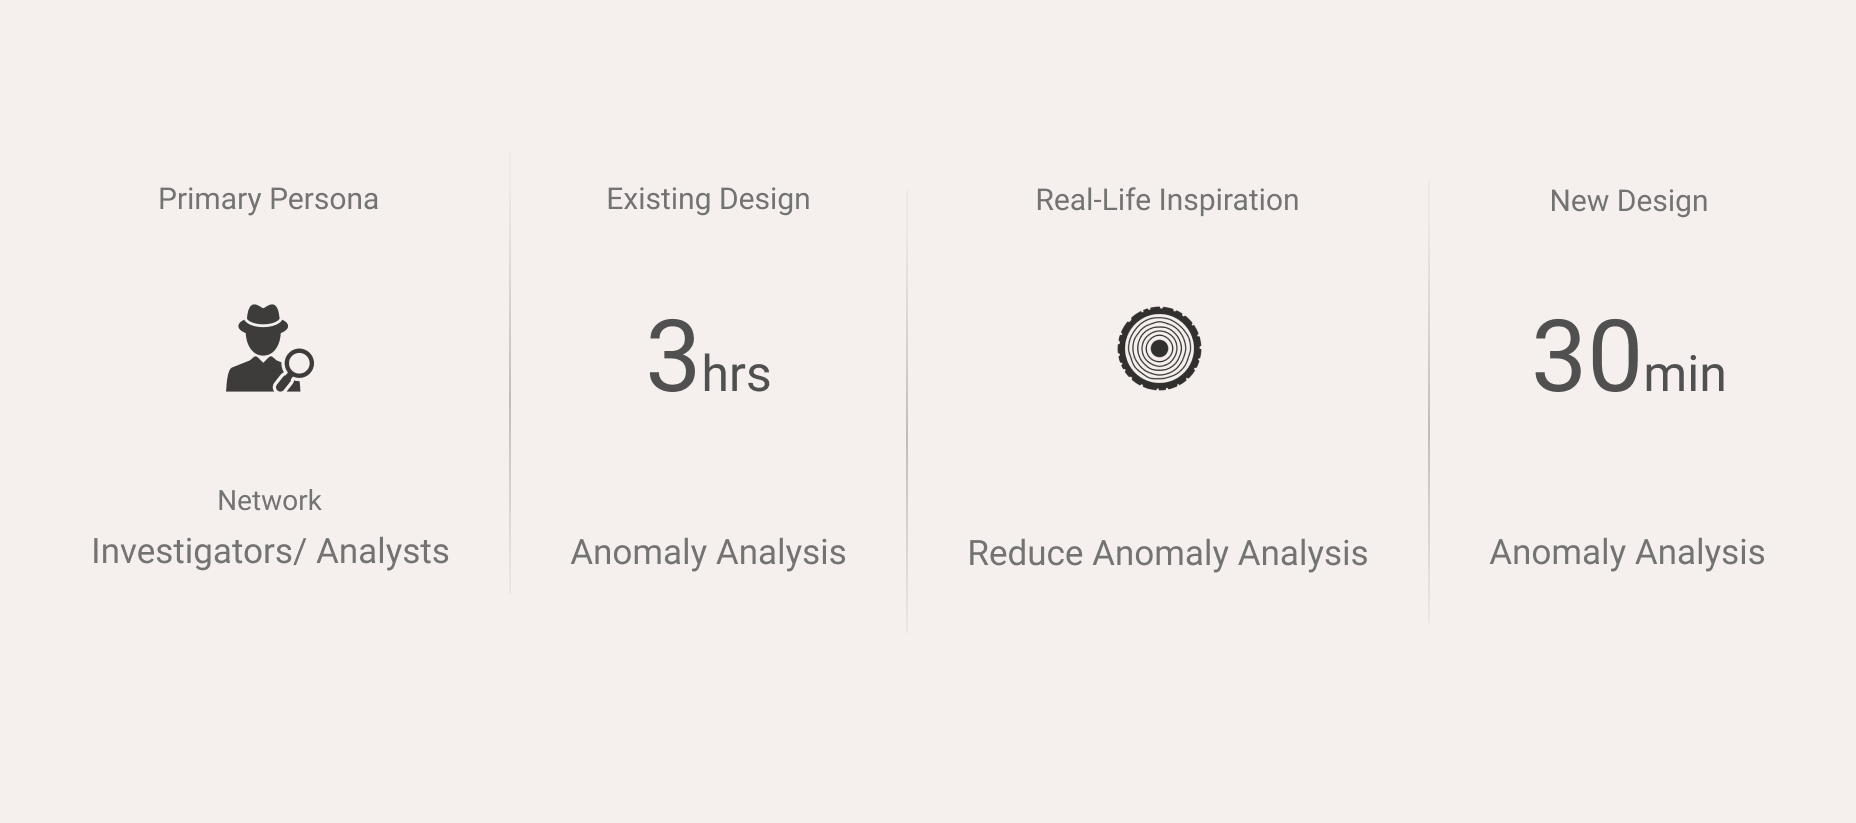
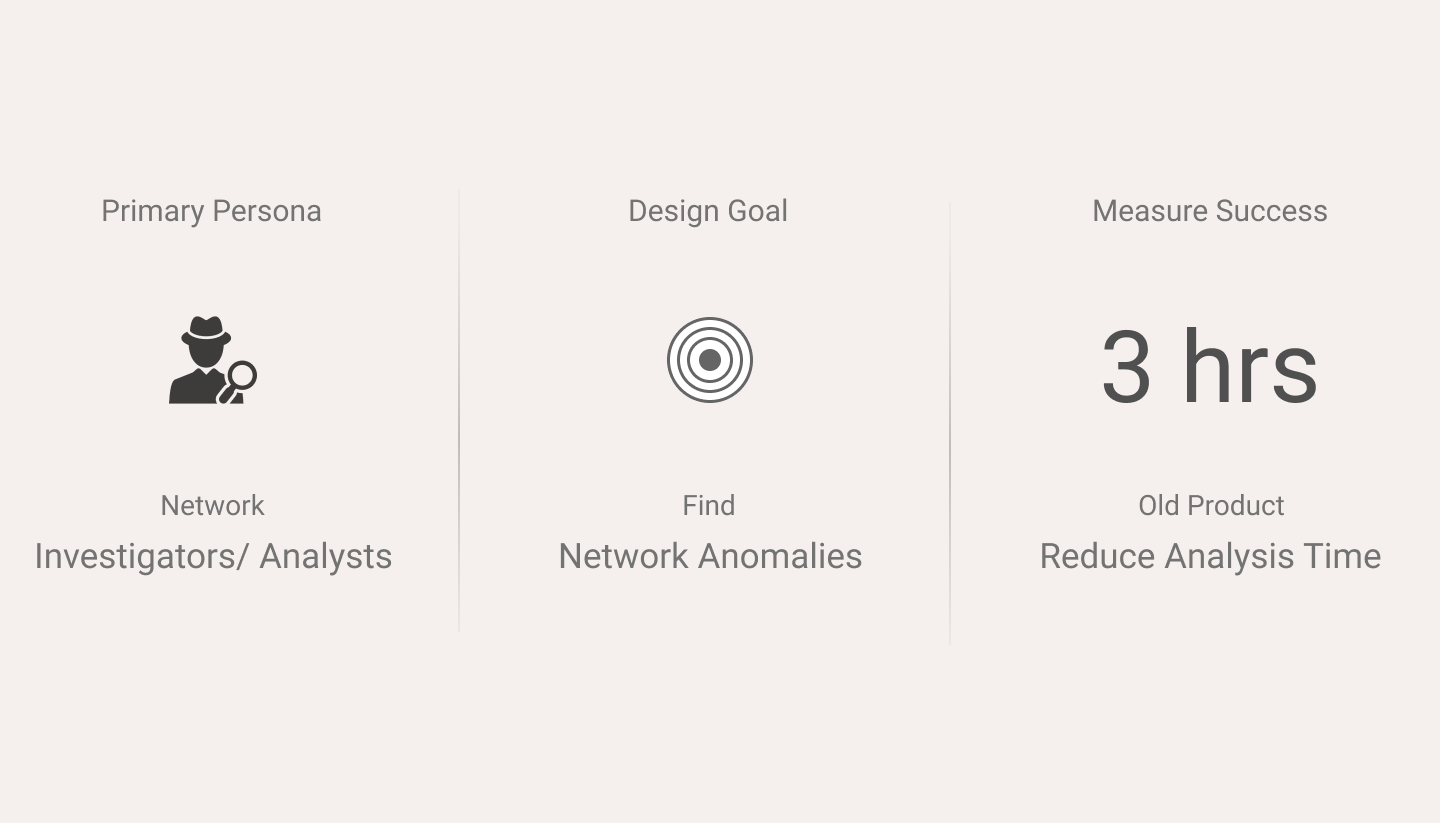
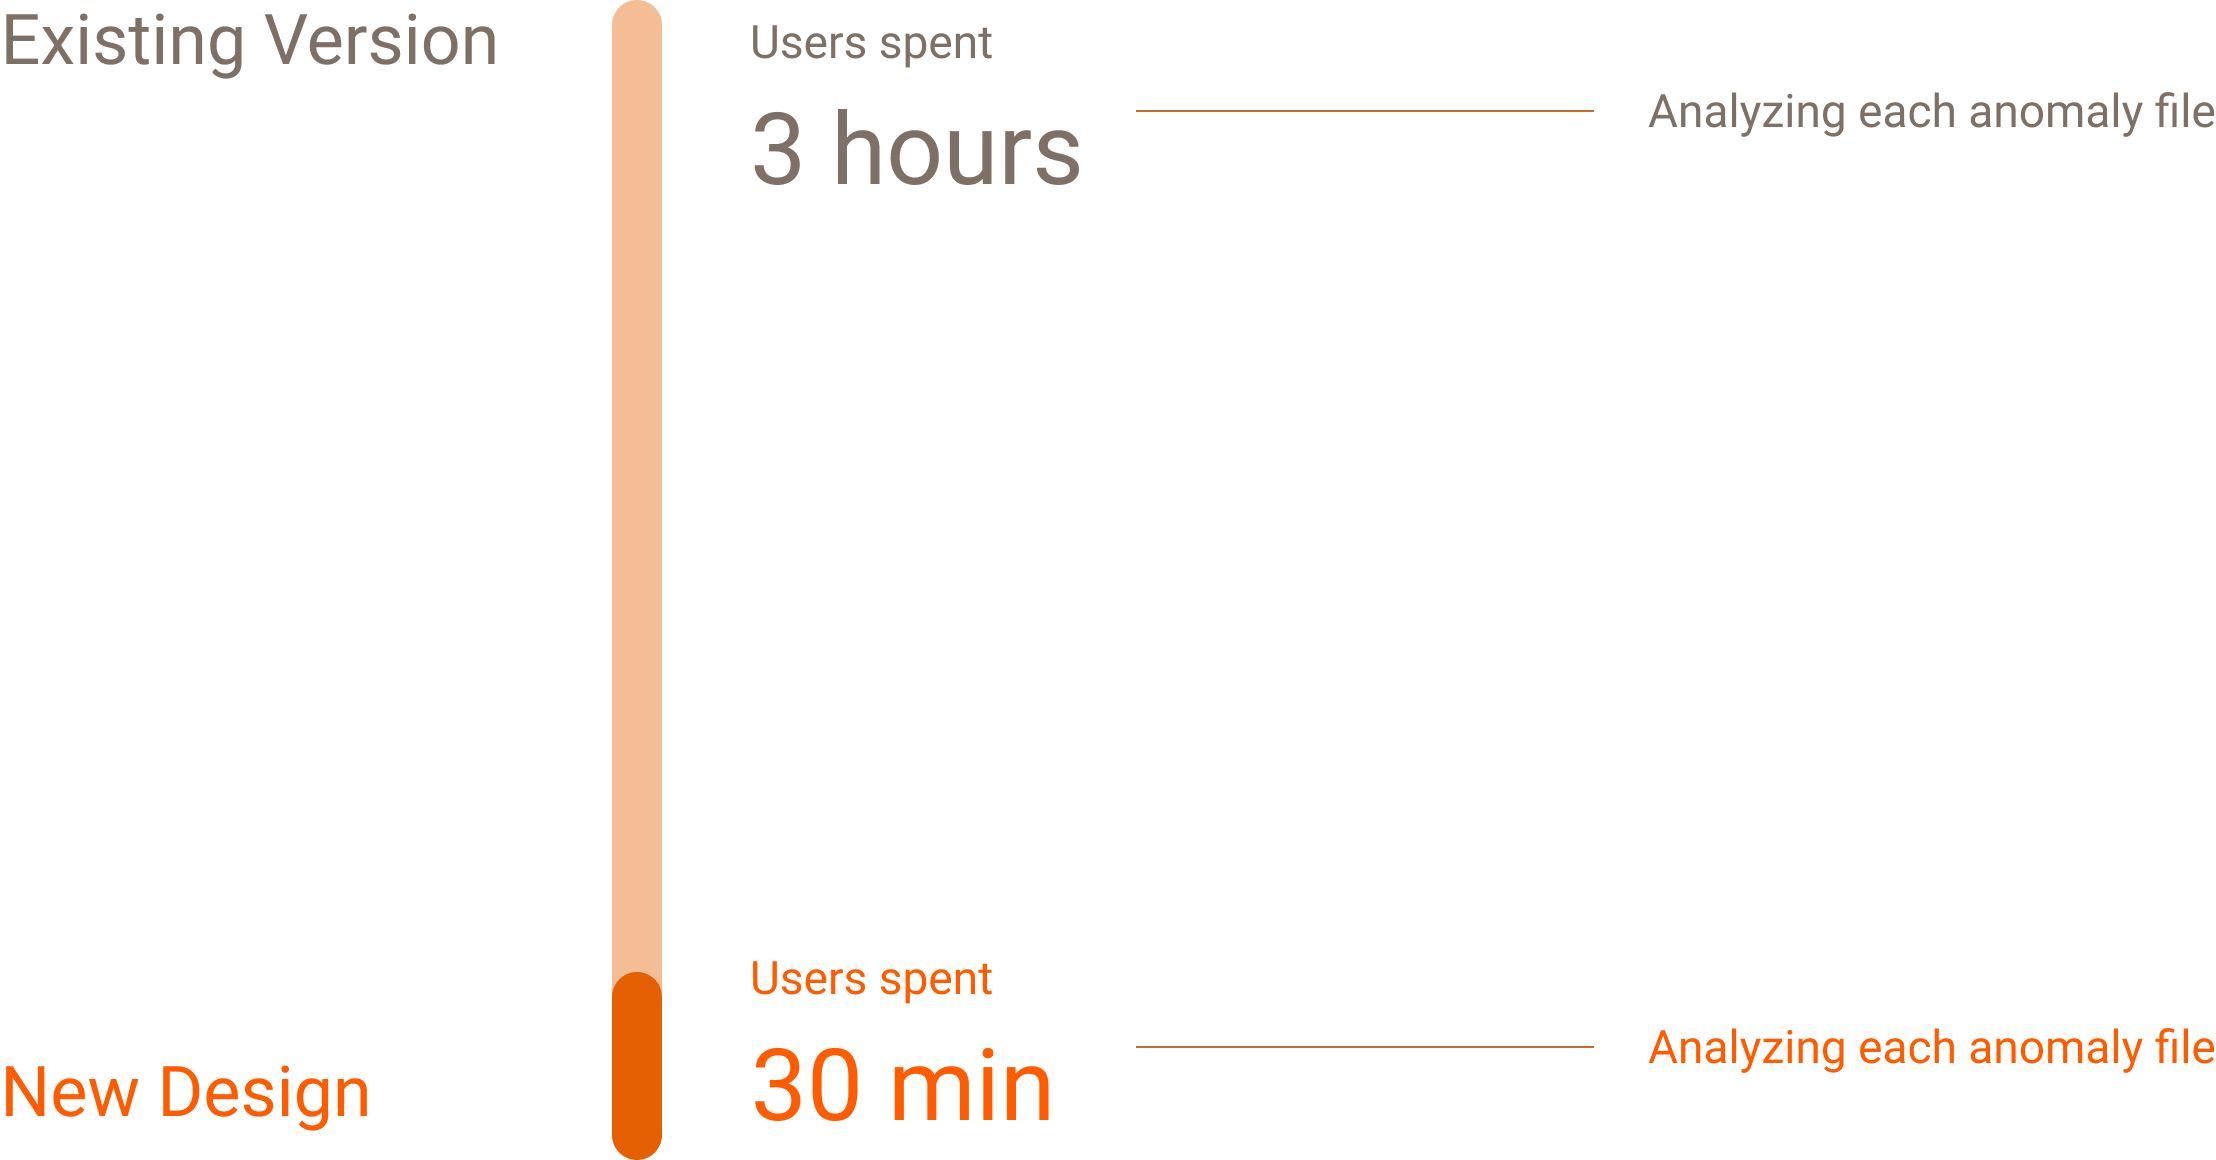
Users had to spend around 3 hours per file to identify if this file is malicious.
User Research
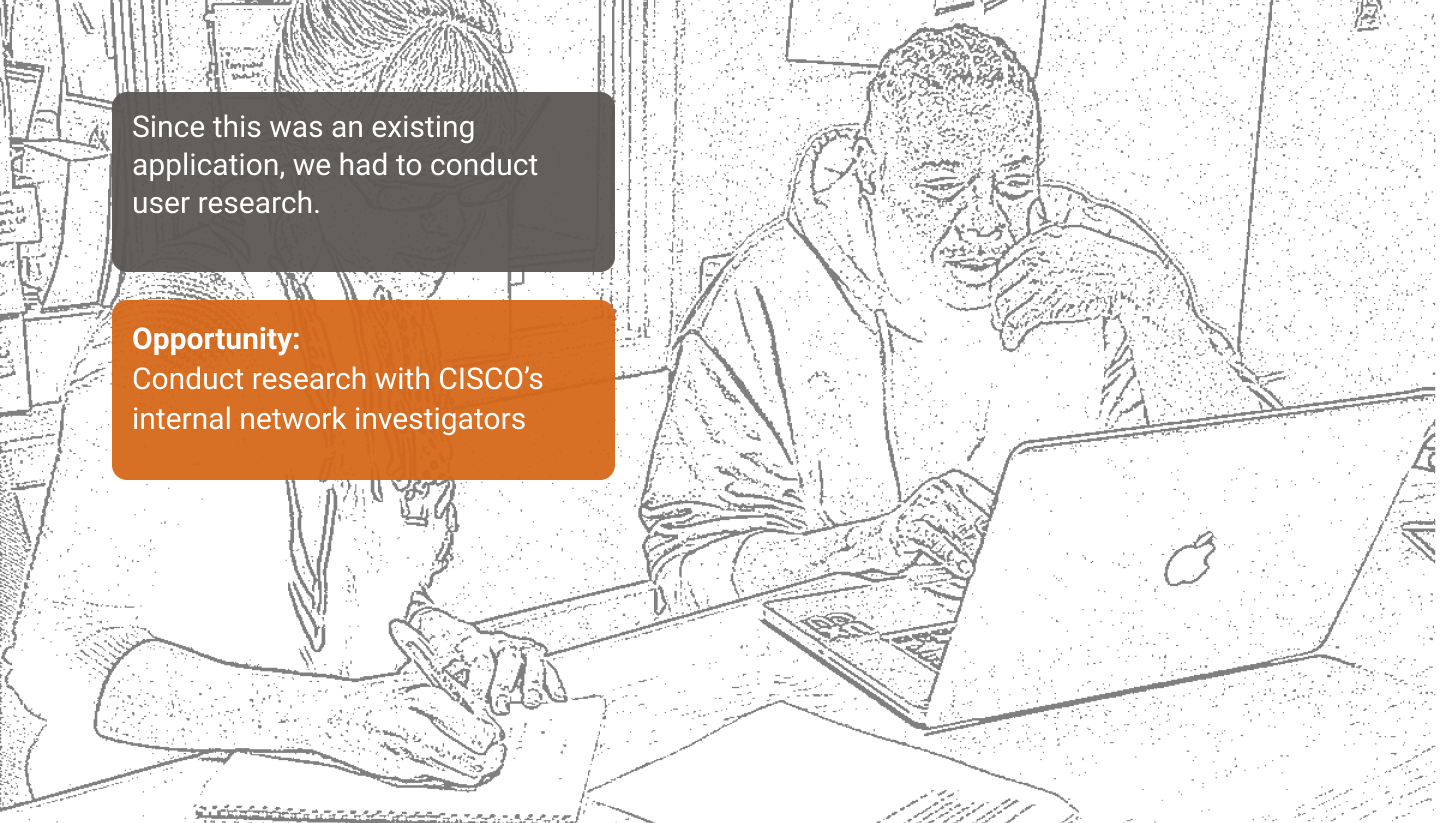
Research Analysis
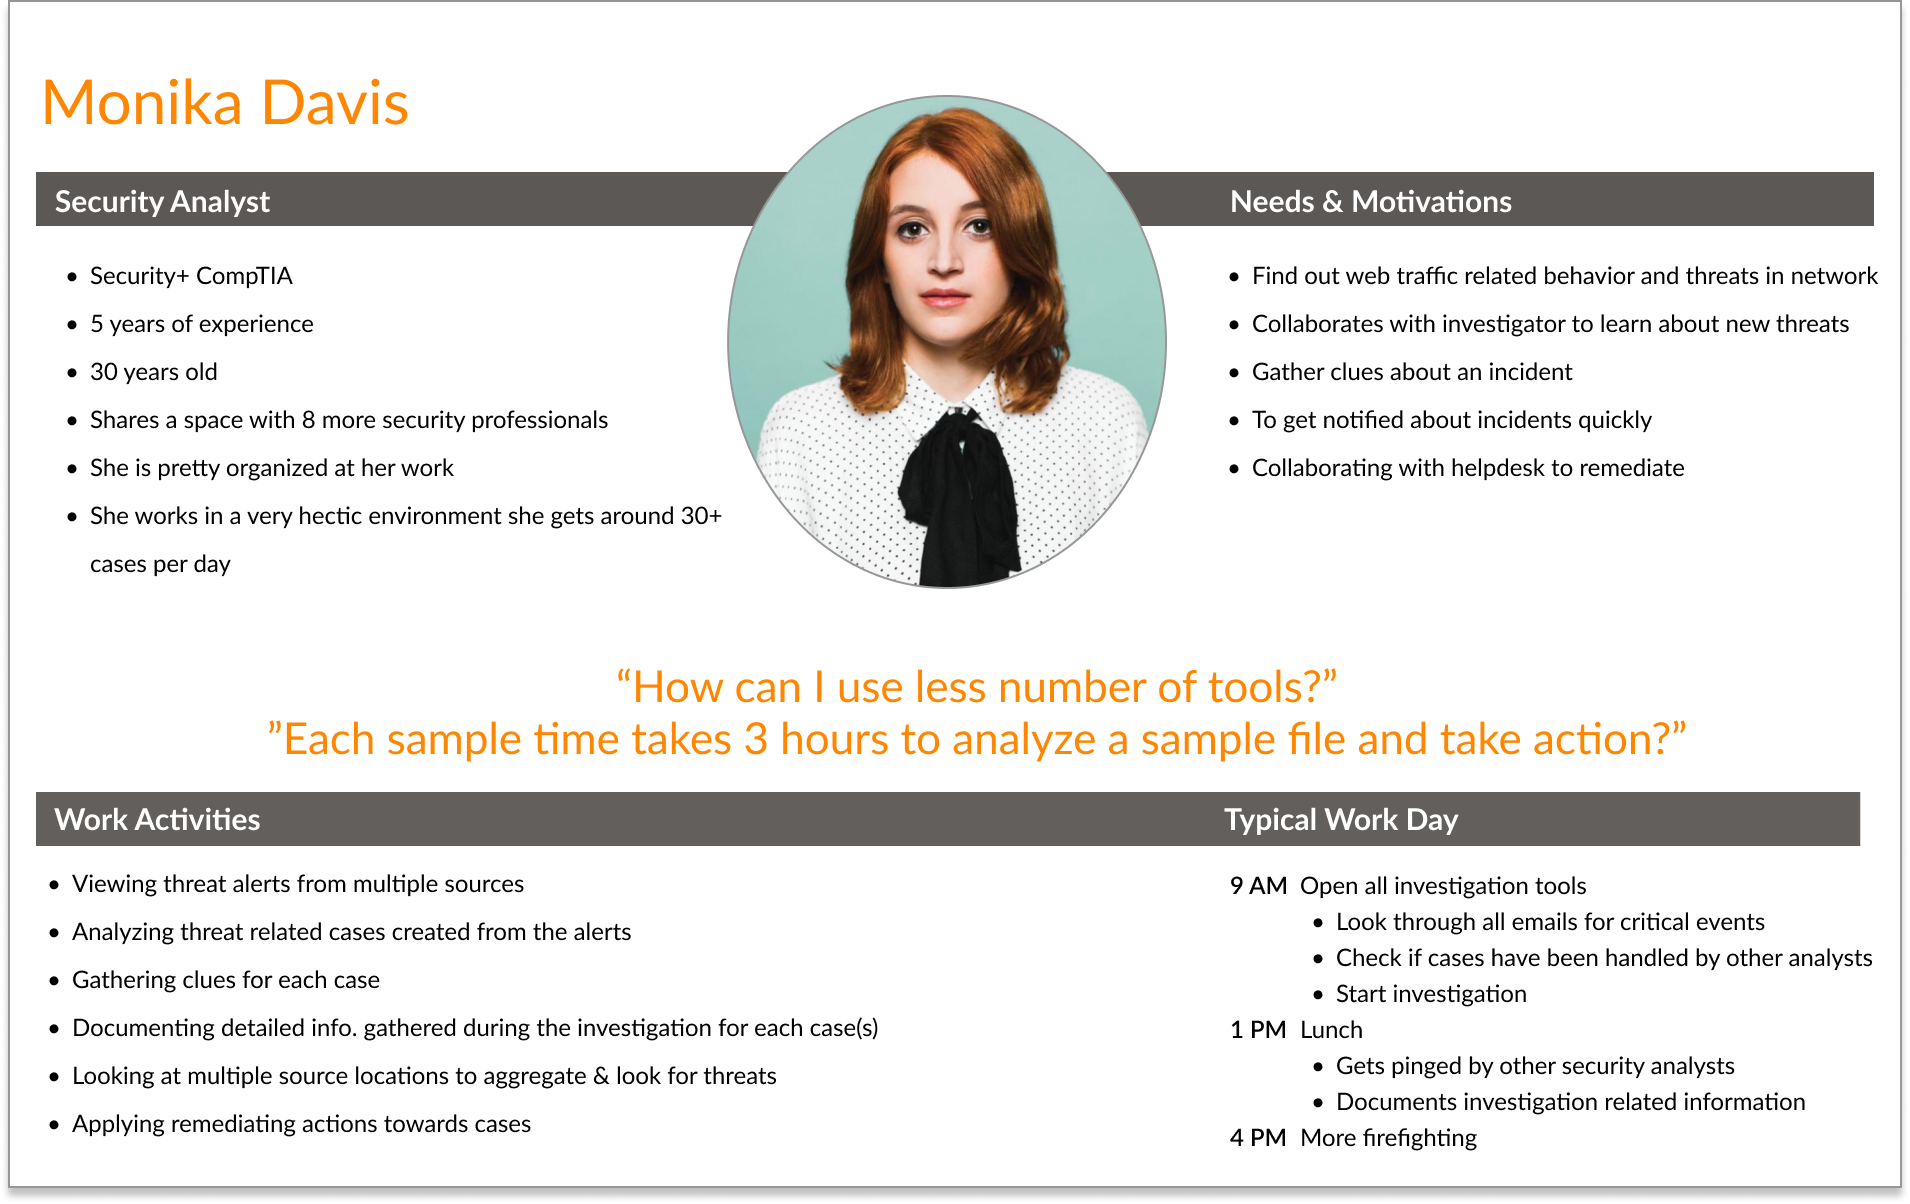
No. of Analysts Interviewed
7
Current Product Analysis Time
3 hrs.
No. of Cases Raised Per Day
200

Real Life
Inspiration
Images speak louder than words; our brains process them 60,000 times faster. As organizations seek data-driven decisions, understanding meaningful data is crucial. Humans naturally gravitate towards designs that mirror their environment.
My goal was to use visualization, that was inspired by real-life objects to solve user problems.
Setting The User Goals
Collaborated With Product Management
How might we provide security teams with context-rich insights into the activities of files on the network to enhance malware detection and response
How might we assist the user in analyzing file behavior against millions of recognizable patterns to enhance detection and response capabilities?
How might we develop a system to highlight key behavioral indicators of malware that require user attention?
How might we help our users understand and respond to threats more quickly and effectively?
Measure Success
Reduce the time taken for the user to identify malicious activity within a submitted file and to take the appropriate actions to mitigate the suspicious behavior.
Design Rationale
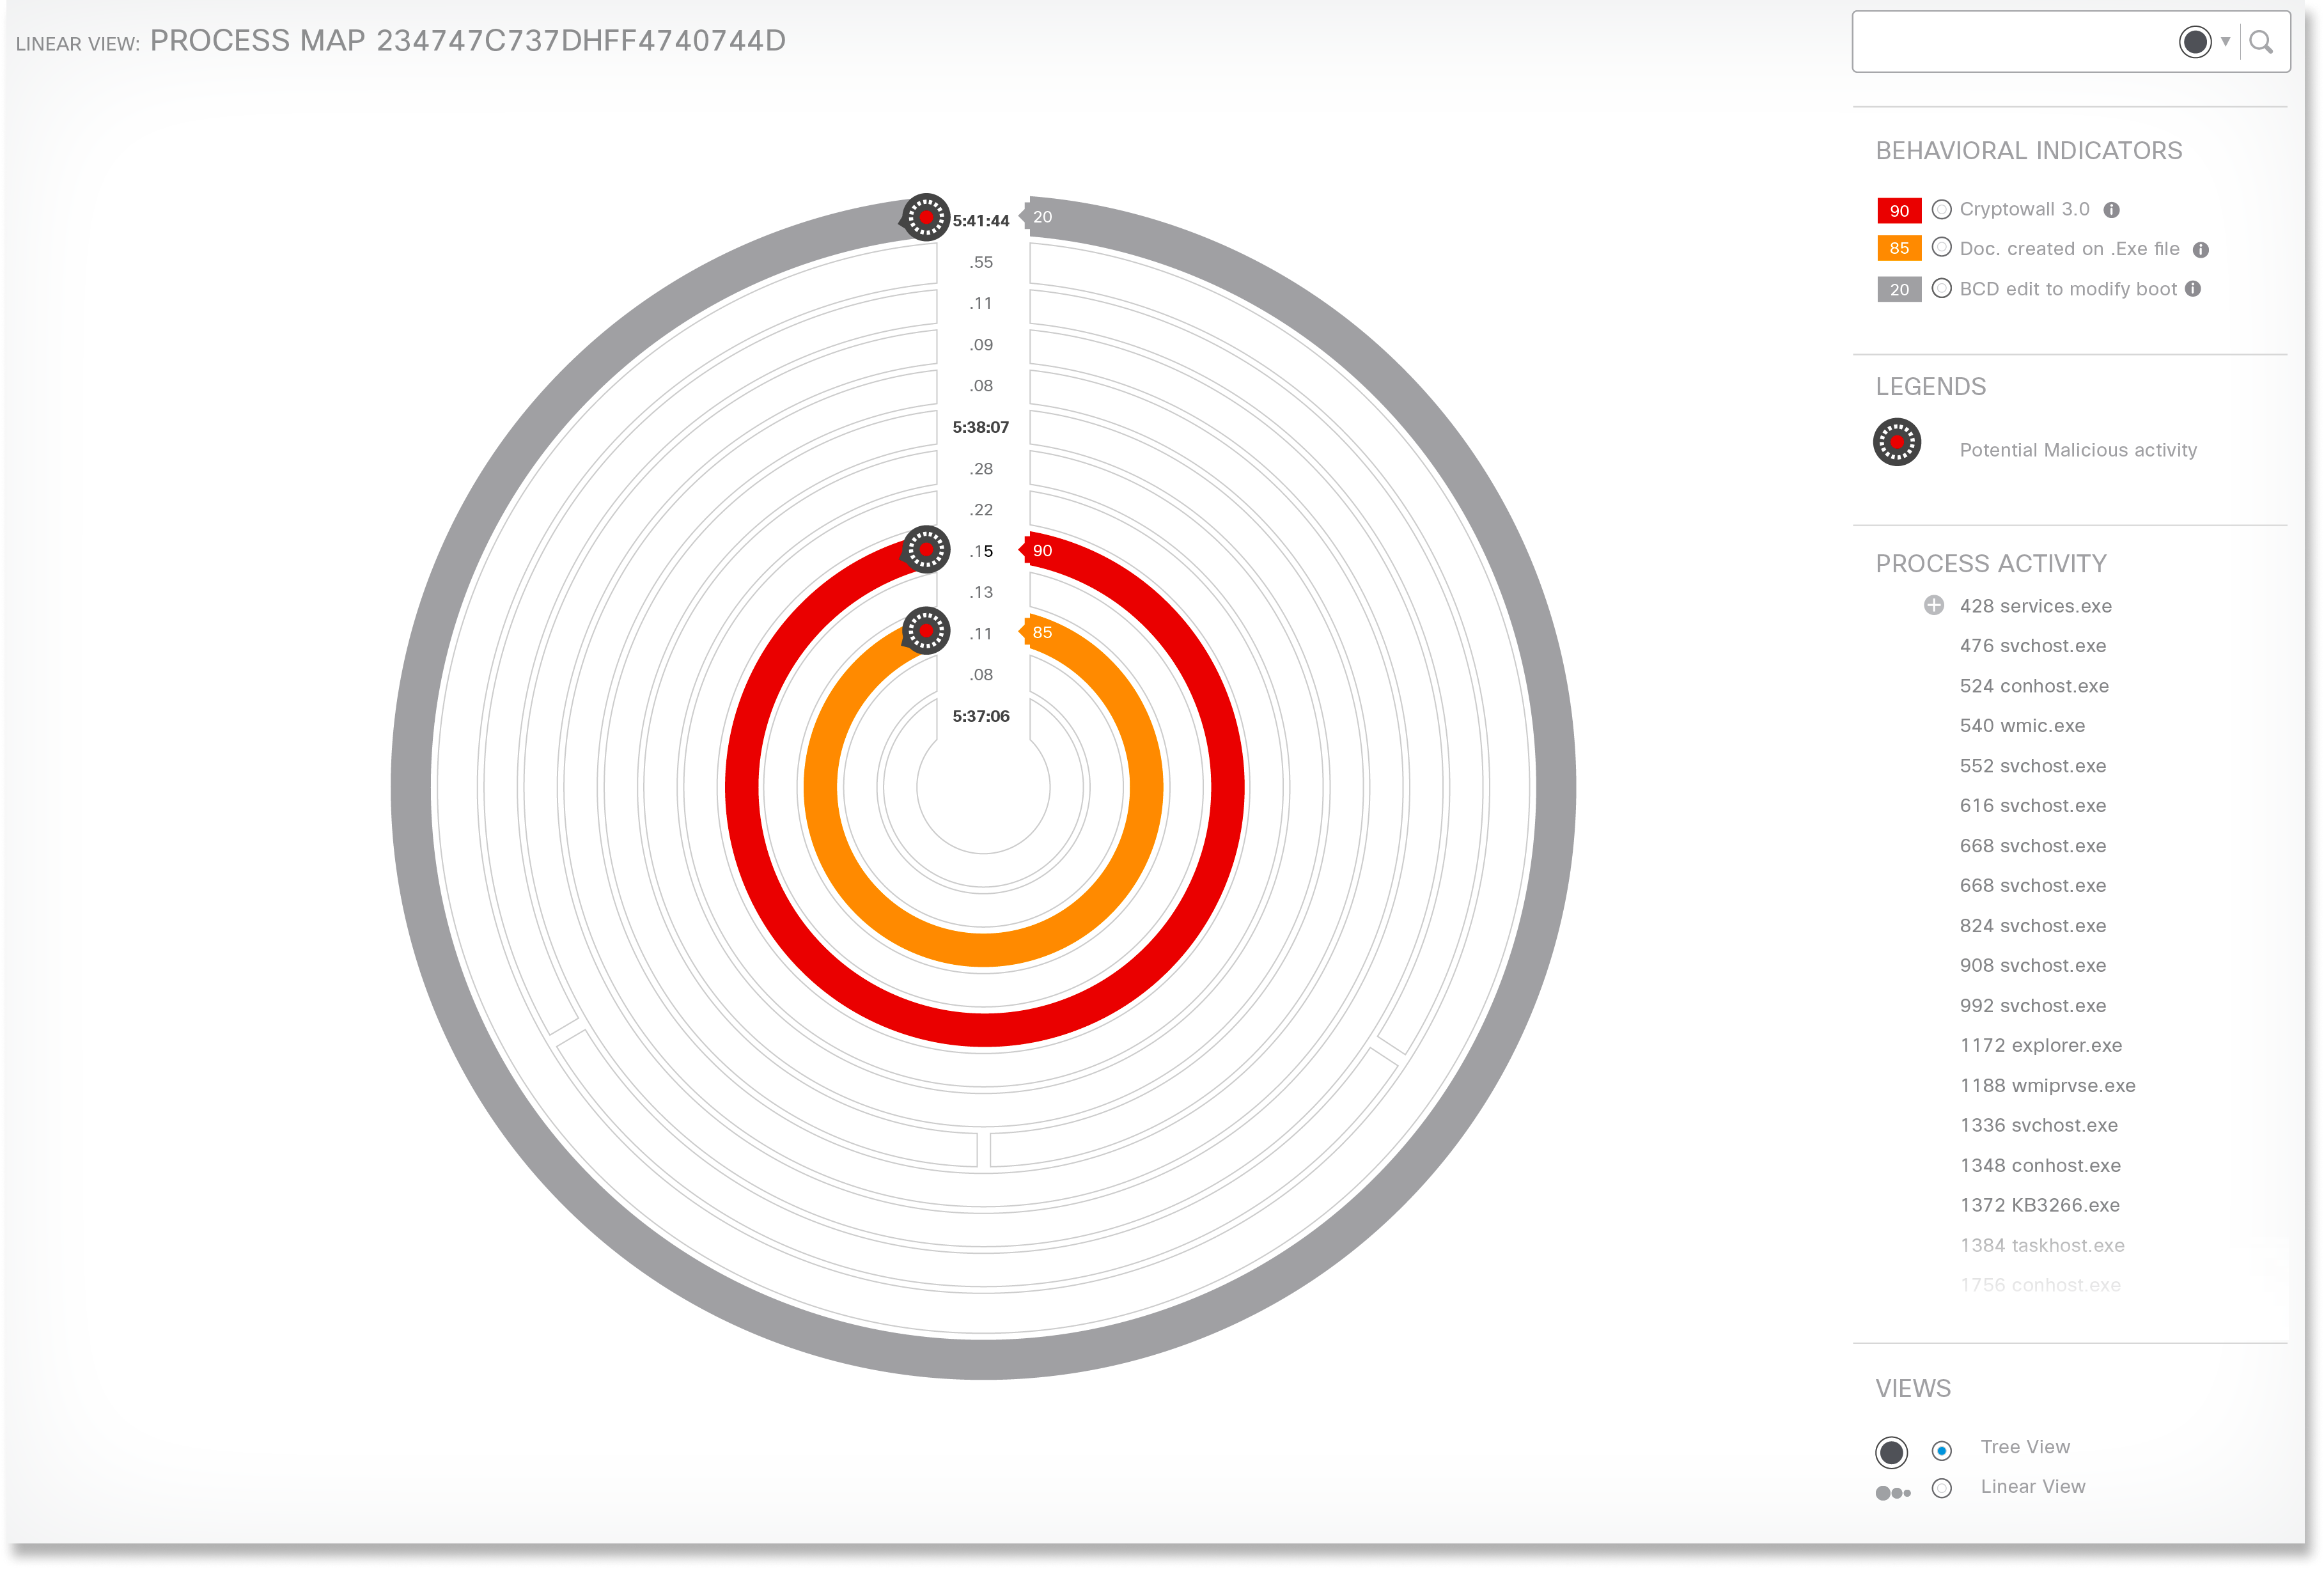
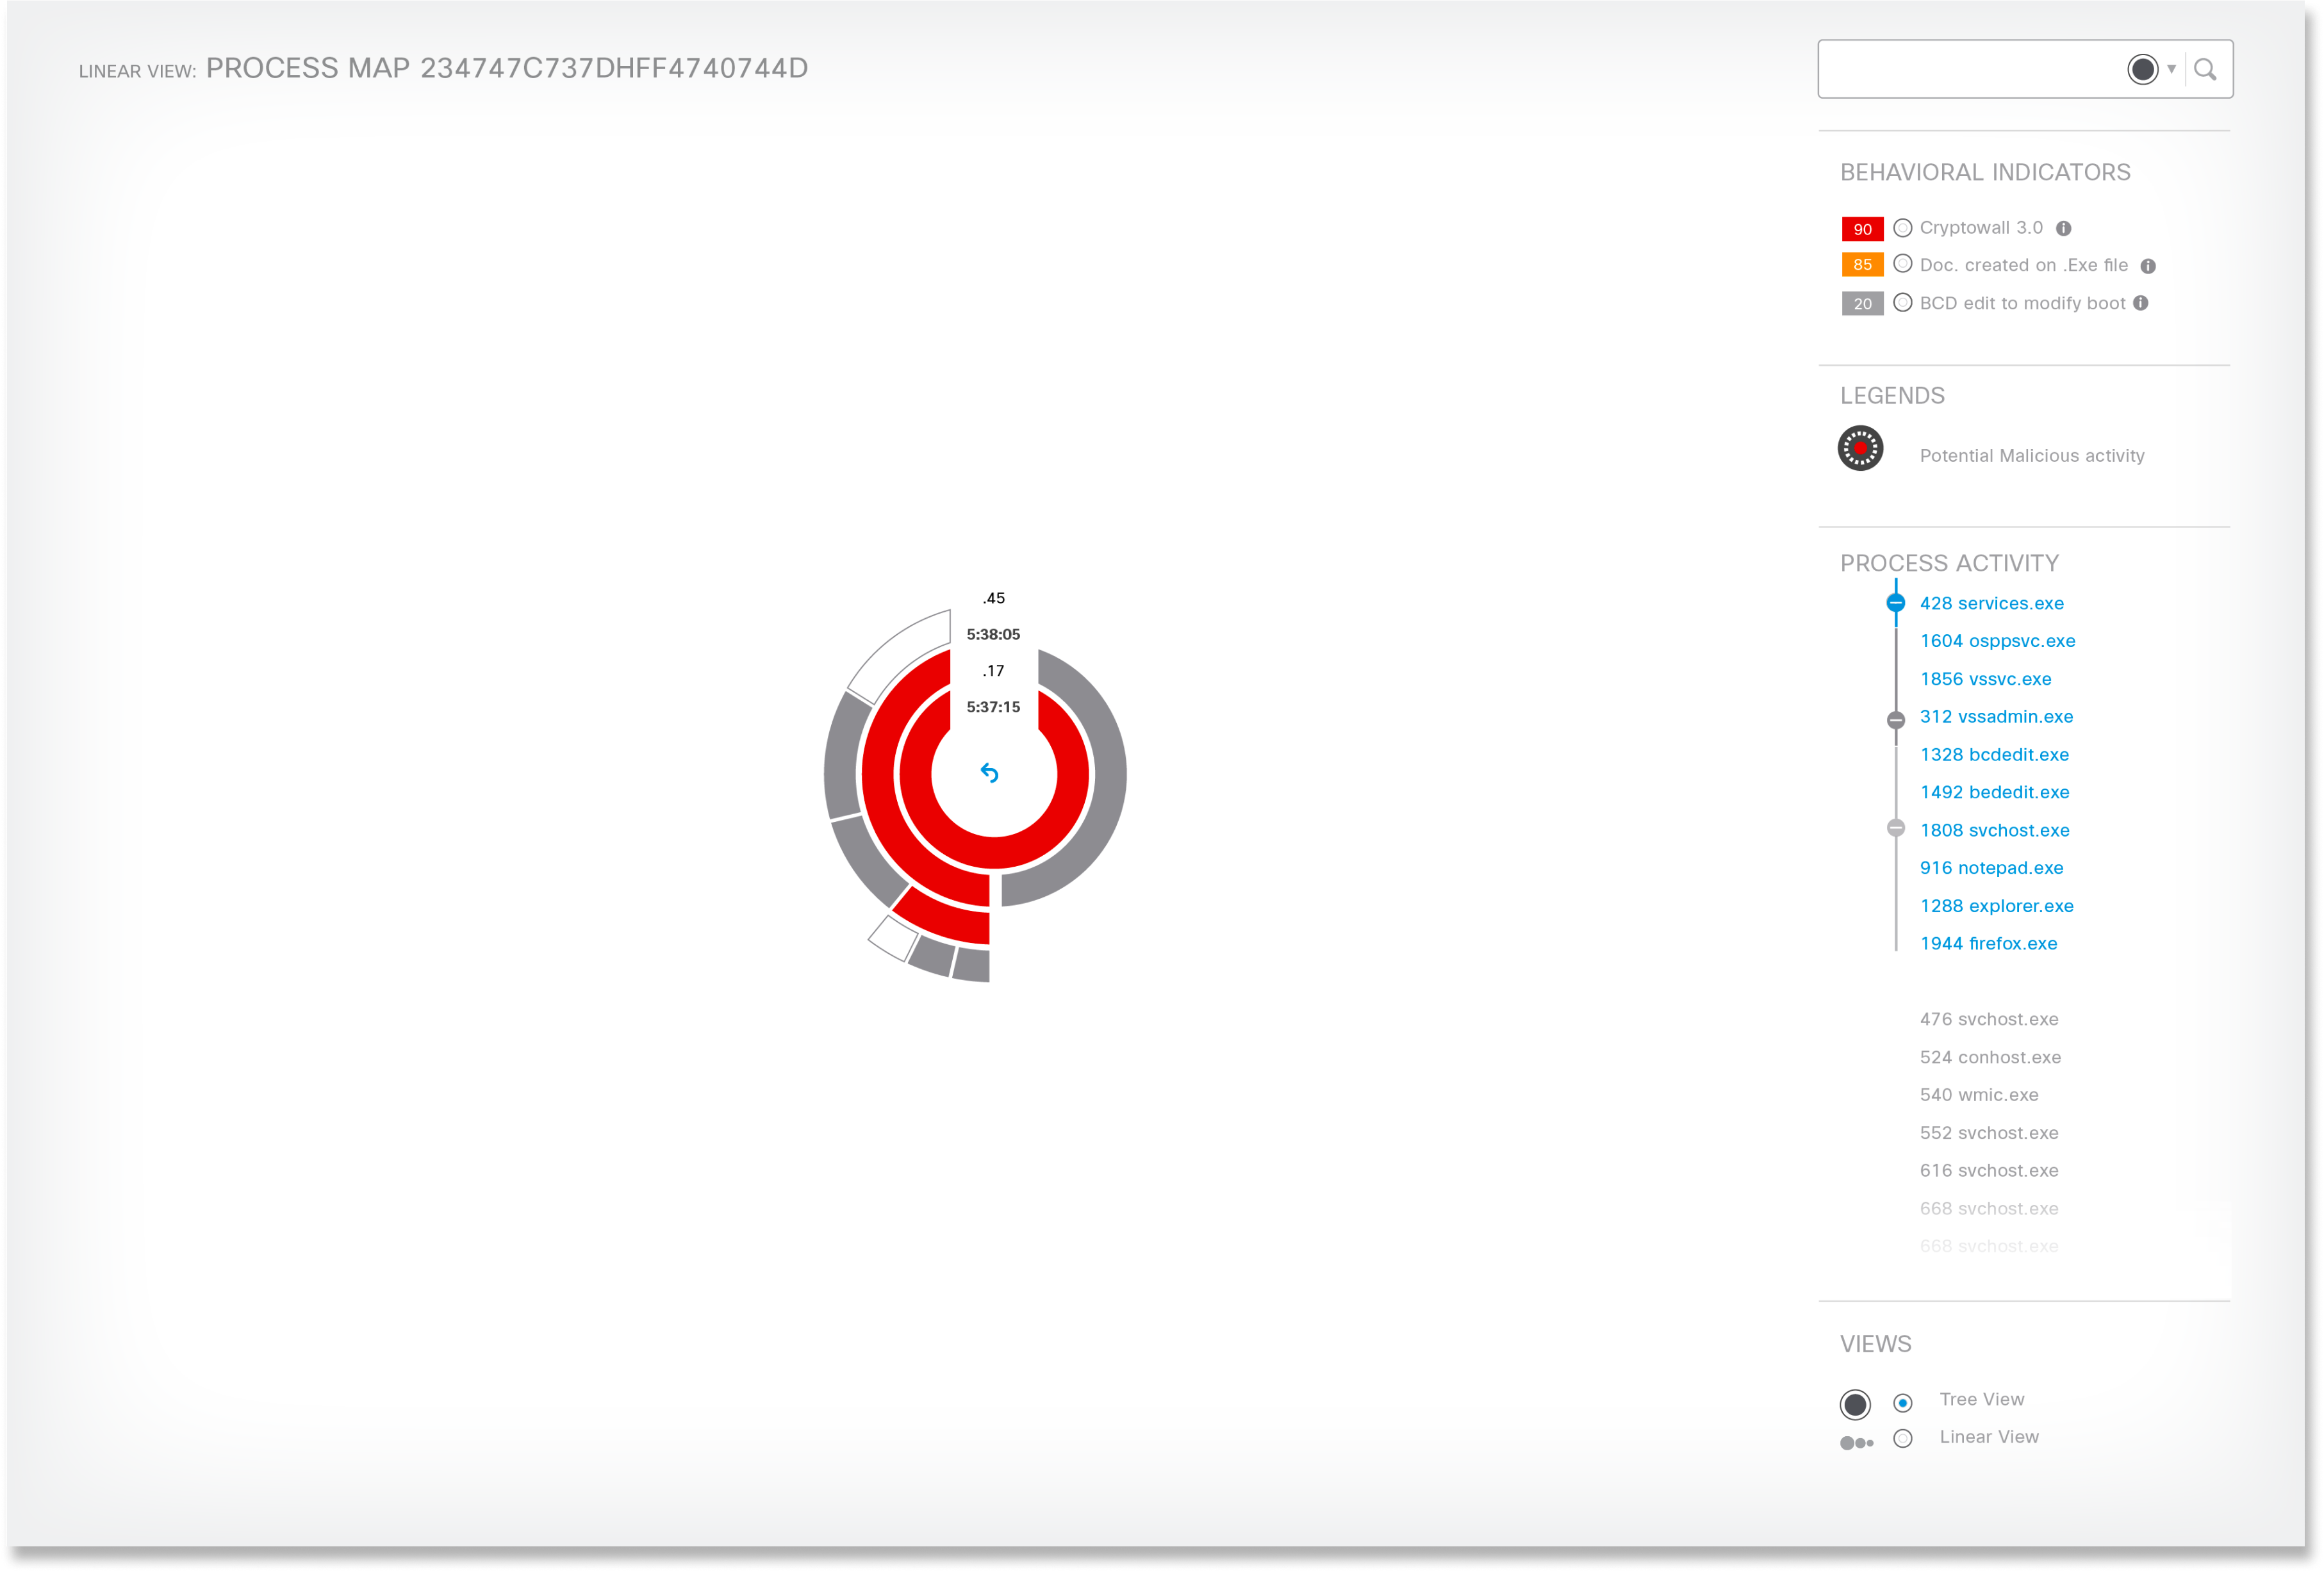
This design visually flagged potential malicious activities in red (Critical) or orange (Less Critical) rings, allowing users to delve deeper by clicking on them for more details. This streamlined investigation time by focusing attention on critical activities.
Challenge:
Getting engineering team On-board
Getting them On-Board:
1. How can this product be the market differentiator
2. Involving them in usability tests
3. Researching other competitors products
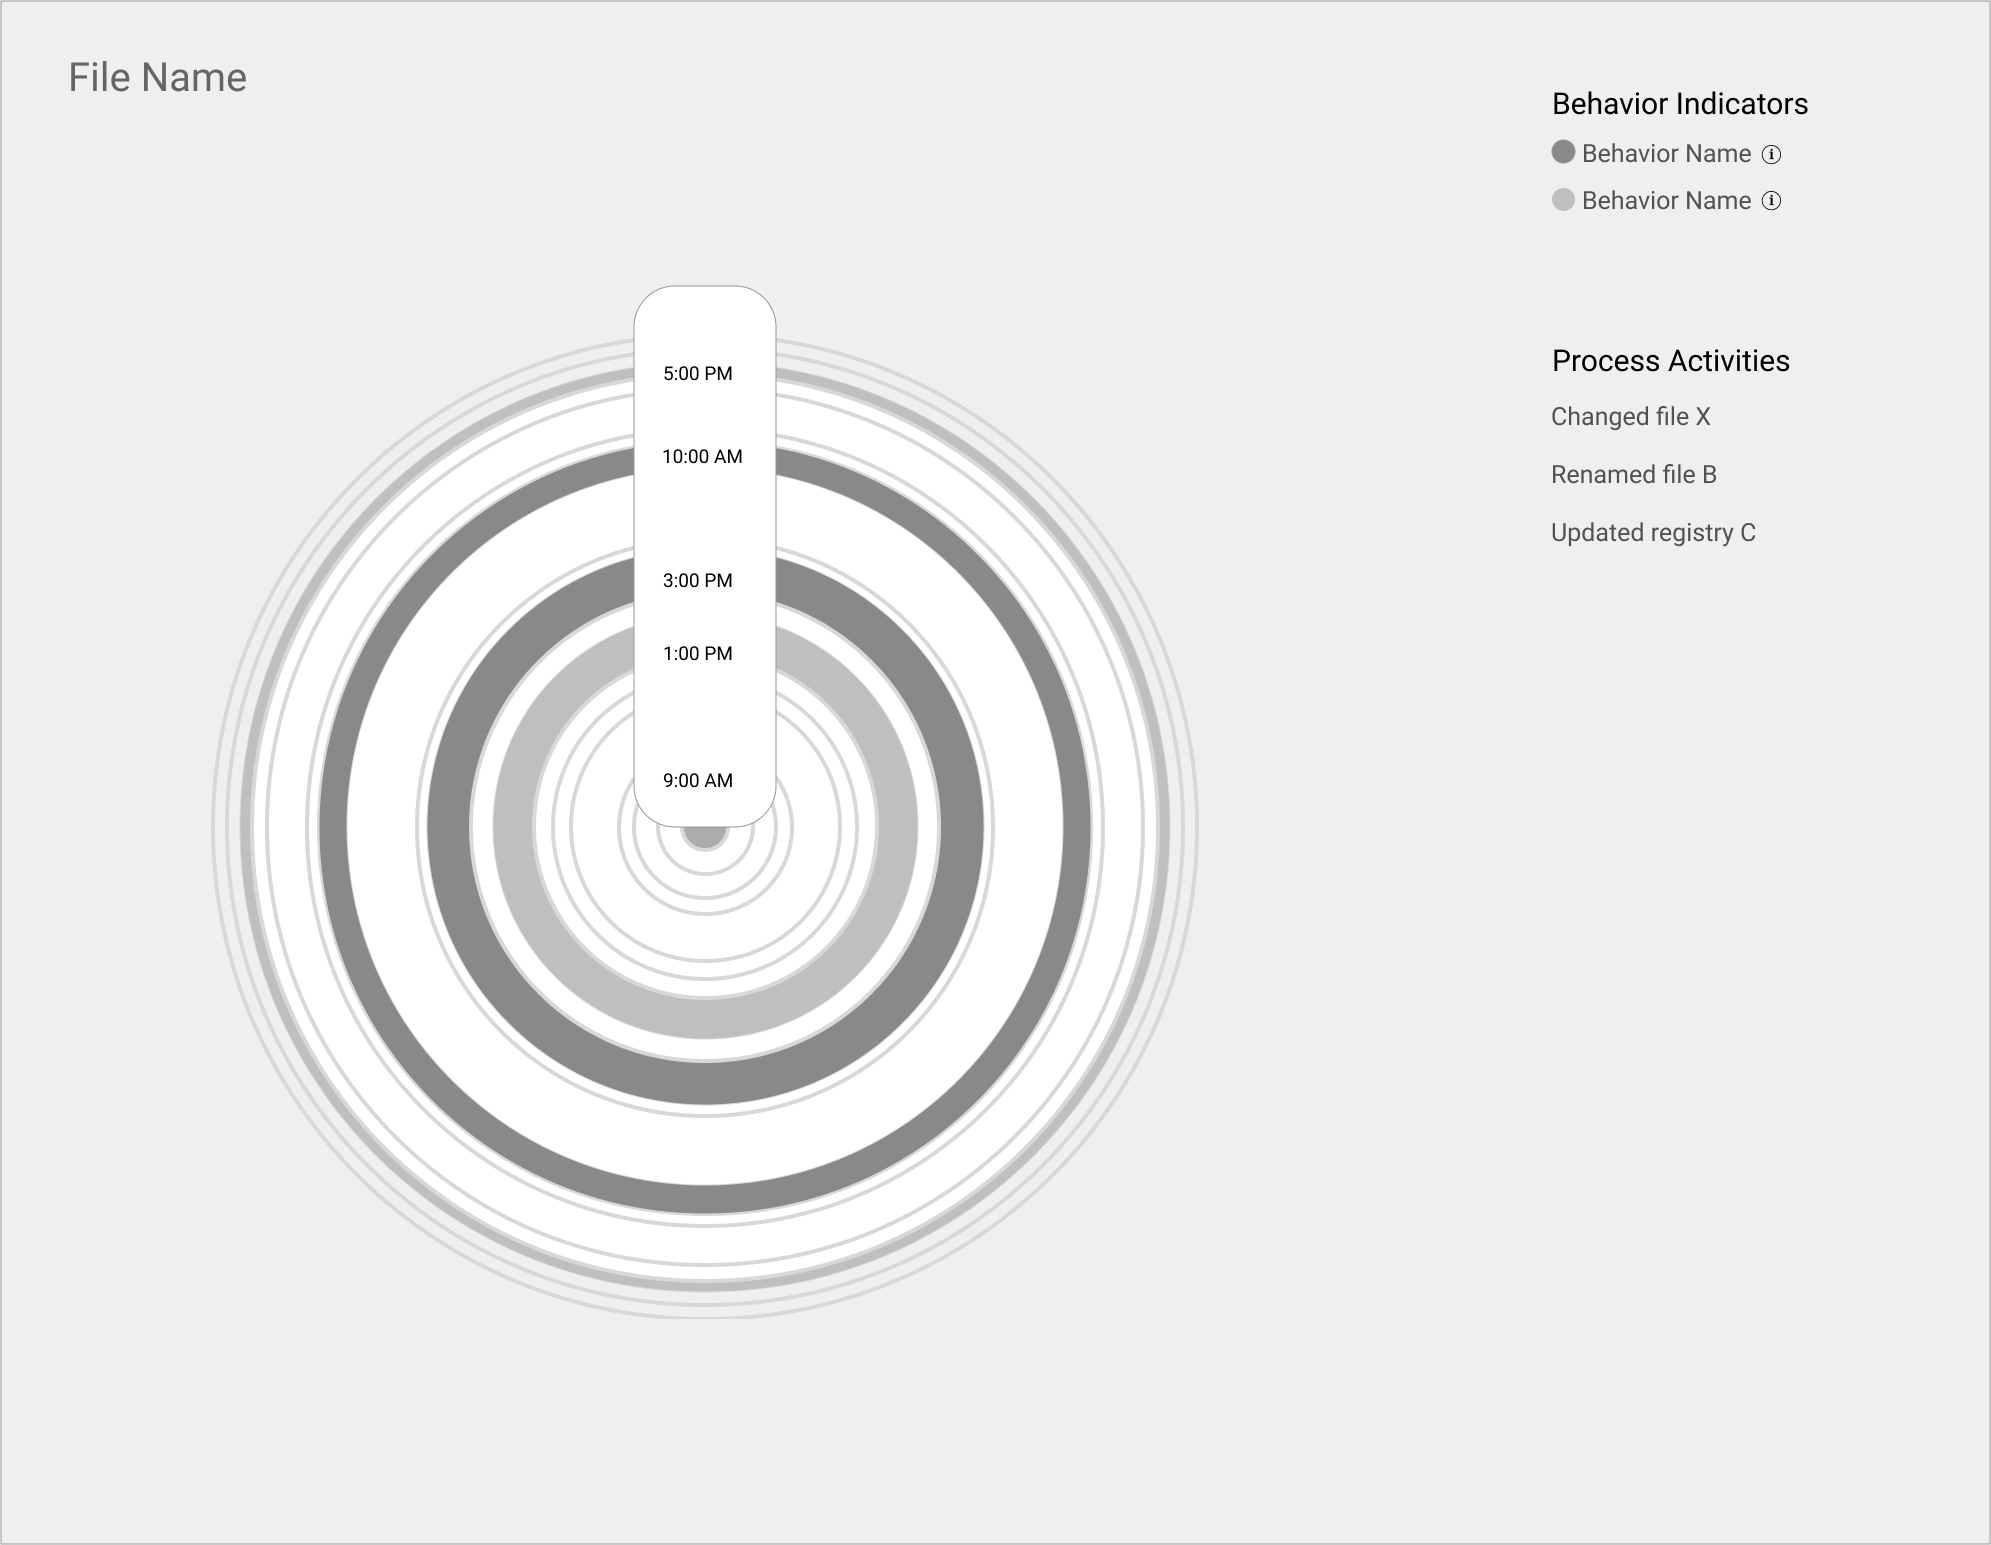
Final Design
Design Impact
Summary
